29
/fr/
fr
AIzaSyAYiBZKx7MnpbEhh9jyipgxe19OcubqV5w
April 1, 2024
111061
Congo, Rep.
COG
true
2
1
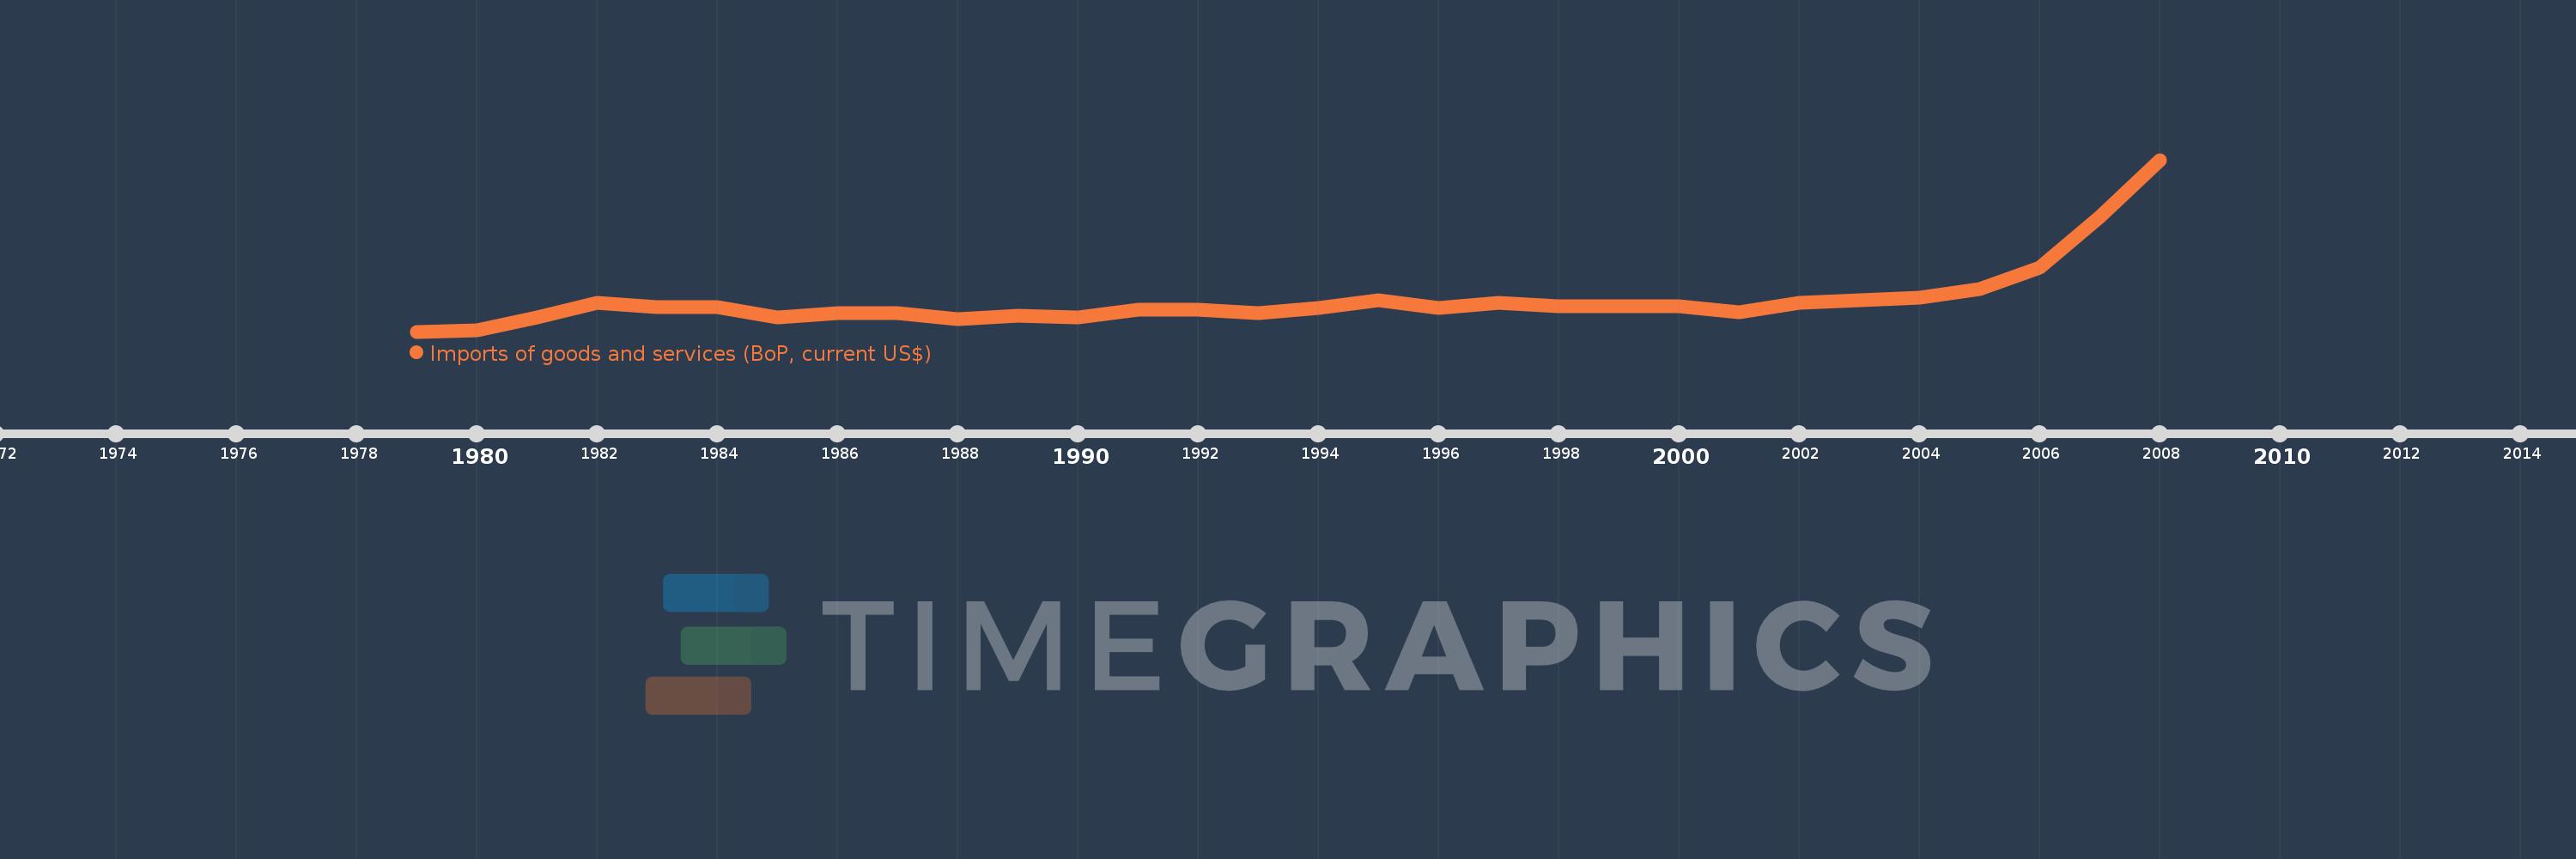
Imports of goods and services (BoP, current US$)
2008,2007,2006,2005,2004,2003,2002,2001,2000,1999,1998,1997,1996,1995,1994,1993,1992,1991,1990,1989,1988,1987,1986,1985,1984,1983,1982,1981,1980,1979
Cette statistique dans les autres pays:
AfghanistanAlbaniaAlgeriaAngolaAntigua and BarbudaArab WorldArgentinaArmeniaArubaAustraliaAustriaAzerbaijanBahamas, TheBahrainBangladeshBarbadosBelarusBelgiumBelizeBeninBermudaBhutanBoliviaBosnia and HerzegovinaBotswanaBrazilBrunei DarussalamBulgariaBurkina FasoBurundiCabo VerdeCambodiaCameroonCanadaCaribbean small statesCentral African RepublicCentral Europe and the BalticsChadChileChinaColombiaComorosCongo, Dem. Rep.Congo, Rep.Costa RicaCote d'IvoireCroatiaCuracaoCyprusCzech RepublicDenmarkDjiboutiDominicaDominican RepublicEarly-demographic dividendEast Asia & PacificEast Asia & Pacific (excluding high income)East Asia & Pacific (IDA & IBRD countries)EcuadorEgypt, Arab Rep.El SalvadorEquatorial GuineaEritreaEstoniaEthiopiaEuro areaEurope & Central AsiaEurope & Central Asia (excluding high income)Europe & Central Asia (IDA & IBRD countries)European UnionFaroe IslandsFijiFinlandFragile and conflict affected situationsFranceFrench PolynesiaGabonGambia, TheGeorgiaGermanyGhanaGreeceGrenadaGuatemalaGuineaGuinea-BissauGuyanaHaitiHeavily indebted poor countries (HIPC)High incomeHondurasHong Kong SAR, ChinaHungaryIBRD onlyIcelandIDA & IBRD totalIDA blendIDA onlyIDA totalIndiaIndonesiaIran, Islamic Rep.IraqIrelandIsraelItalyJamaicaJapanJordanKazakhstanKenyaKiribatiKorea, Rep.KosovoKuwaitKyrgyz RepublicLao PDRLate-demographic dividendLatin America & Caribbean Latin America & Caribbean (excluding high income)Latin America & the Caribbean (IDA & IBRD countries)LatviaLeast developed countries: UN classificationLebanonLesothoLiberiaLibyaLithuaniaLow & middle incomeLow incomeLower middle incomeLuxembourgMacao SAR, ChinaMacedonia, FYRMadagascarMalawiMalaysiaMaldivesMaliMaltaMarshall IslandsMauritaniaMauritiusMexicoMicronesia, Fed. Sts.Middle East & North Africa (excluding high income)Middle East & North Africa (IDA & IBRD countries)Middle incomeMoldovaMongoliaMontenegroMoroccoMozambiqueMyanmarNamibiaNepalNetherlandsNew CaledoniaNicaraguaNigerNigeriaNorth AmericaNorwayOECD membersOmanOther small statesPacific island small statesPakistanPalauPanamaPapua New GuineaParaguayPeruPhilippinesPolandPortugalPost-demographic dividendPre-demographic dividendQatarRomaniaRussian FederationRwandaSamoaSao Tome and PrincipeSaudi ArabiaSenegalSerbiaSeychellesSierra LeoneSingaporeSint Maarten (Dutch part)Slovak RepublicSloveniaSmall statesSolomon IslandsSouth AfricaSouth AsiaSouth Asia (IDA & IBRD)South SudanSpainSri LankaSt. Kitts and NevisSt. LuciaSt. Vincent and the GrenadinesSub-Saharan Africa Sub-Saharan Africa (excluding high income)Sub-Saharan Africa (IDA & IBRD countries)SudanSurinameSwazilandSwedenSwitzerlandSyrian Arab RepublicTajikistanTanzaniaThailandTimor-LesteTogoTongaTrinidad and TobagoTunisiaTurkeyTuvaluUgandaUkraineUnited KingdomUnited StatesUpper middle incomeUruguayVanuatuVenezuela, RBVietnamWest Bank and GazaWorldYemen, Rep.ZambiaZimbabwe La ligne de temps
Cette échelle de temps montre un graphique de 1979 année à 2008 année Congo, Rep.. Les données jusqu'à 1978 année ne sont pas présentés. Quantité d'observations actuelles selon dates: 30.
Source (désignation):
Les indicateurs du développement mondiale
Source (organisation):
International Monetary Fund, Balance of Payments Statistics Yearbook and data files.
Catégories:
Economy & Growth, Trade
Dernière mise à jour
23 avr. 2017
Les indicateurs de changement de valeurs selon les années
Minimum:
541.271 mln.
1 janv. 1979
Maximum:
6.386 mds
1 janv. 2008
Pour la date d''observation
Valeur
Changement absolu
Le changement par rapport à la valeur précédente
1 janv. 1979
541.271 mln.
+541.271 mln.
0.0%
1 janv. 1980
582.794 mln.
+41.523 mln.
7.67%
1 janv. 1981
1.025 mds
+442.463 mln.
75.92%
1 janv. 1982
1.517 mds
+491.63 mln.
47.95%
1 janv. 1983
1.361 mds
-155.717 mln.
-10.27%
1 janv. 1984
1.377 mds
+15.702 mln.
1.15%
1 janv. 1985
1.009 mds
-367.984 mln.
-26.73%
1 janv. 1986
1.156 mds
+146.75 mln.
14.55%
1 janv. 1987
1.169 mds
+13.572 mln.
1.17%
1 janv. 1988
951.964 mln.
-217.245 mln.
-18.58%
1 janv. 1989
1.083 mds
+130.876 mln.
13.75%
1 janv. 1990
1.026 mds
-56.848 mln.
-5.25%
1 janv. 1991
1.282 mds
+255.848 mln.
24.94%
1 janv. 1992
1.281 mds
-765.766 milles
-0.06%
1 janv. 1993
1.176 mds
-105.368 mln.
-8.22%
1 janv. 1994
1.346 mds
+169.81 mln.
14.44%
1 janv. 1995
1.609 mds
+263.079 mln.
19.55%
1 janv. 1996
1.346 mds
-262.736 mln.
-16.33%
1 janv. 1997
1.523 mds
+177.315 mln.
13.17%
1 janv. 1998
1.397 mds
-125.862 mln.
-8.26%
1 janv. 1999
1.416 mds
+18.541 mln.
1.33%
1 janv. 2000
1.391 mds
-24.604 mln.
-1.74%
1 janv. 2001
1.194 mds
-197.641 mln.
-14.21%
1 janv. 2002
1.534 mds
+339.903 mln.
28.48%
1 janv. 2003
1.618 mds
+84.513 mln.
5.51%
1 janv. 2004
1.707 mds
+88.615 mln.
5.48%
1 janv. 2005
1.985 mds
+278.652 mln.
16.33%
1 janv. 2006
2.723 mds
+737.336 mln.
37.14%
1 janv. 2007
4.429 mds
+1.707 mds
62.69%
1 janv. 2008
6.386 mds
+1.956 mds
44.17%
Classement des pays selon les statistiques actuelles par années


Commentaires: