29
/fr/
fr
AIzaSyAYiBZKx7MnpbEhh9jyipgxe19OcubqV5w
April 1, 2024
238376
Seychelles
SYC
true
2
1
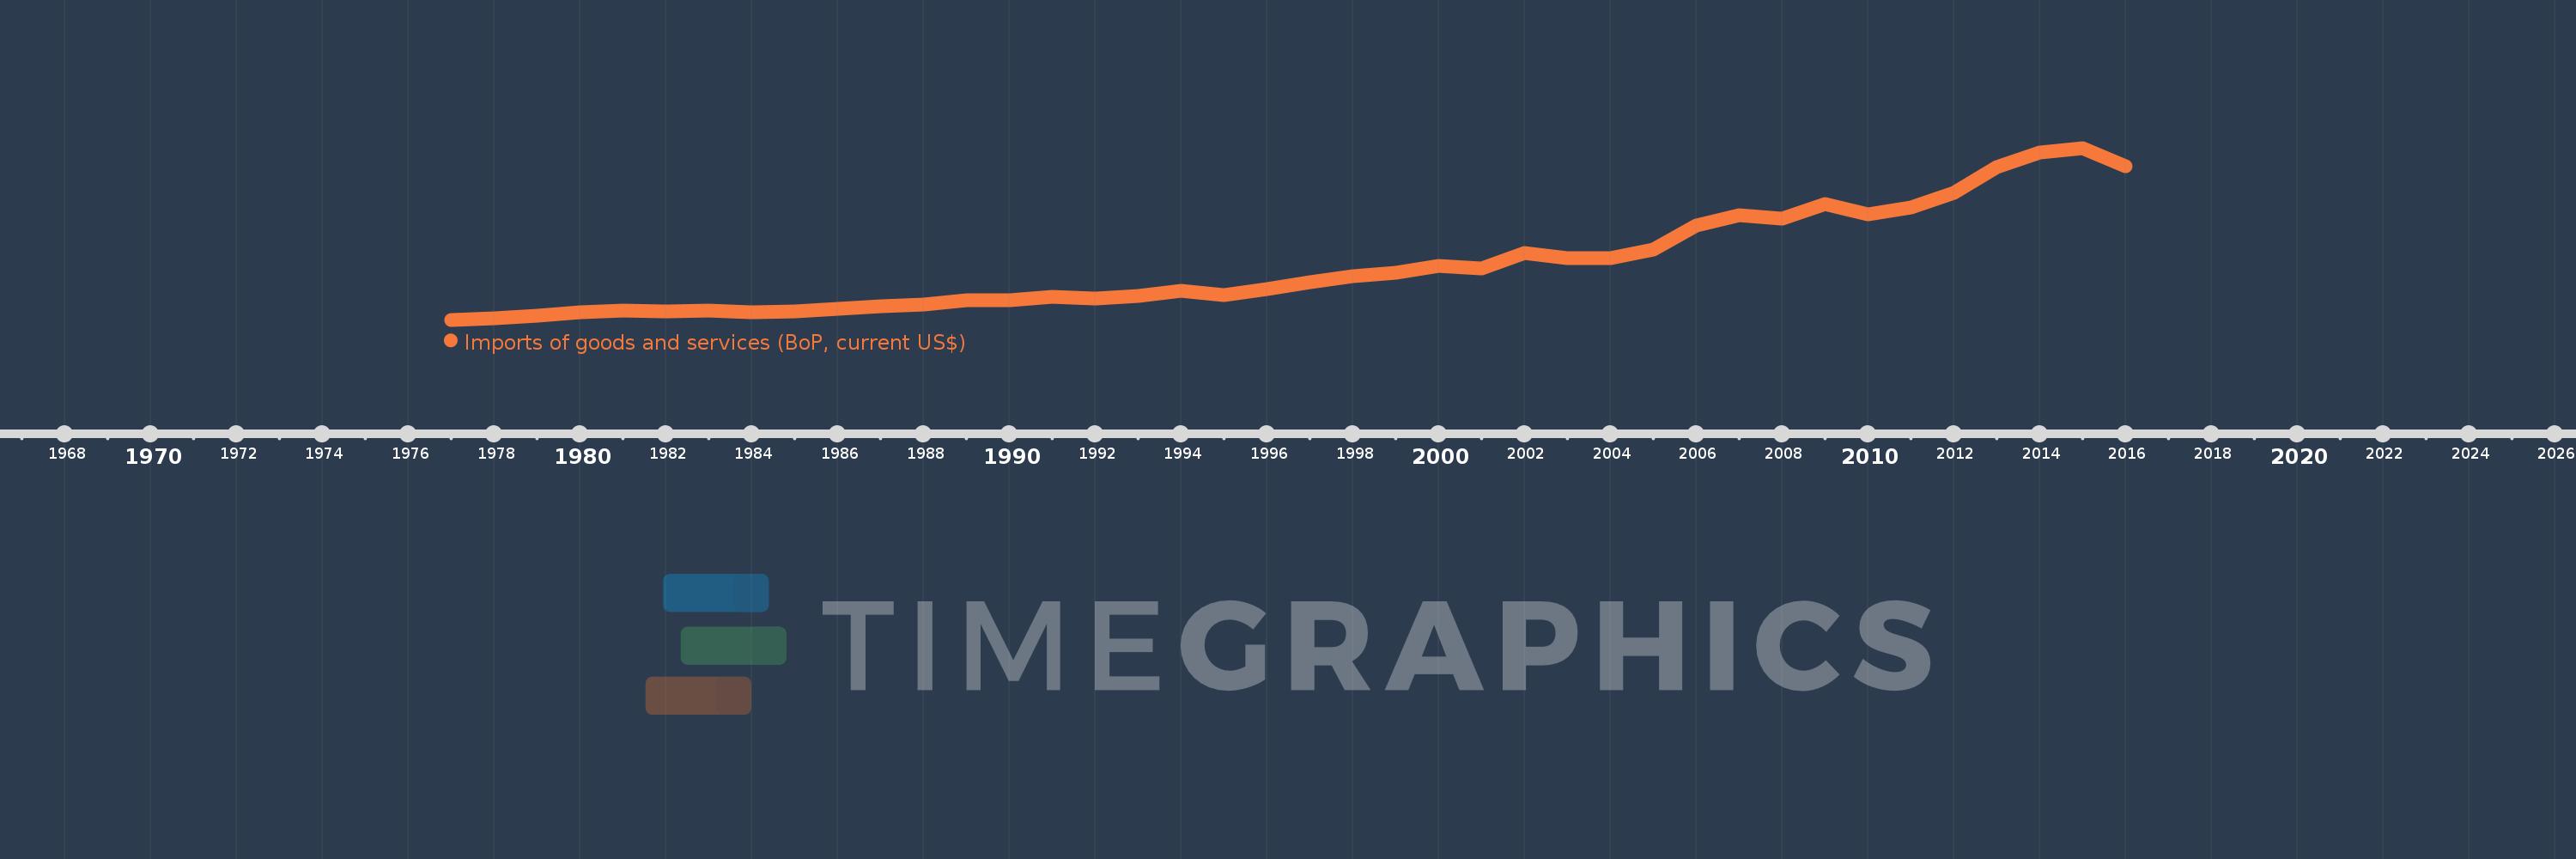
Imports of goods and services (BoP, current US$)
2016,2015,2014,2013,2012,2011,2010,2009,2008,2007,2006,2005,2004,2003,2002,2001,2000,1999,1998,1997,1996,1995,1994,1993,1992,1991,1990,1989,1988,1987,1986,1985,1984,1983,1982,1981,1980,1979,1978,1977
Cette statistique dans les autres pays:
AfghanistanAlbaniaAlgeriaAngolaAntigua and BarbudaArab WorldArgentinaArmeniaArubaAustraliaAustriaAzerbaijanBahamas, TheBahrainBangladeshBarbadosBelarusBelgiumBelizeBeninBermudaBhutanBoliviaBosnia and HerzegovinaBotswanaBrazilBrunei DarussalamBulgariaBurkina FasoBurundiCabo VerdeCambodiaCameroonCanadaCaribbean small statesCentral African RepublicCentral Europe and the BalticsChadChileChinaColombiaComorosCongo, Dem. Rep.Congo, Rep.Costa RicaCote d'IvoireCroatiaCuracaoCyprusCzech RepublicDenmarkDjiboutiDominicaDominican RepublicEarly-demographic dividendEast Asia & PacificEast Asia & Pacific (excluding high income)East Asia & Pacific (IDA & IBRD countries)EcuadorEgypt, Arab Rep.El SalvadorEquatorial GuineaEritreaEstoniaEthiopiaEuro areaEurope & Central AsiaEurope & Central Asia (excluding high income)Europe & Central Asia (IDA & IBRD countries)European UnionFaroe IslandsFijiFinlandFragile and conflict affected situationsFranceFrench PolynesiaGabonGambia, TheGeorgiaGermanyGhanaGreeceGrenadaGuatemalaGuineaGuinea-BissauGuyanaHaitiHeavily indebted poor countries (HIPC)High incomeHondurasHong Kong SAR, ChinaHungaryIBRD onlyIcelandIDA & IBRD totalIDA blendIDA onlyIDA totalIndiaIndonesiaIran, Islamic Rep.IraqIrelandIsraelItalyJamaicaJapanJordanKazakhstanKenyaKiribatiKorea, Rep.KosovoKuwaitKyrgyz RepublicLao PDRLate-demographic dividendLatin America & Caribbean Latin America & Caribbean (excluding high income)Latin America & the Caribbean (IDA & IBRD countries)LatviaLeast developed countries: UN classificationLebanonLesothoLiberiaLibyaLithuaniaLow & middle incomeLow incomeLower middle incomeLuxembourgMacao SAR, ChinaMacedonia, FYRMadagascarMalawiMalaysiaMaldivesMaliMaltaMarshall IslandsMauritaniaMauritiusMexicoMicronesia, Fed. Sts.Middle East & North Africa (excluding high income)Middle East & North Africa (IDA & IBRD countries)Middle incomeMoldovaMongoliaMontenegroMoroccoMozambiqueMyanmarNamibiaNepalNetherlandsNew CaledoniaNicaraguaNigerNigeriaNorth AmericaNorwayOECD membersOmanOther small statesPacific island small statesPakistanPalauPanamaPapua New GuineaParaguayPeruPhilippinesPolandPortugalPost-demographic dividendPre-demographic dividendQatarRomaniaRussian FederationRwandaSamoaSao Tome and PrincipeSaudi ArabiaSenegalSerbiaSeychellesSierra LeoneSingaporeSint Maarten (Dutch part)Slovak RepublicSloveniaSmall statesSolomon IslandsSouth AfricaSouth AsiaSouth Asia (IDA & IBRD)South SudanSpainSri LankaSt. Kitts and NevisSt. LuciaSt. Vincent and the GrenadinesSub-Saharan Africa Sub-Saharan Africa (excluding high income)Sub-Saharan Africa (IDA & IBRD countries)SudanSurinameSwazilandSwedenSwitzerlandSyrian Arab RepublicTajikistanTanzaniaThailandTimor-LesteTogoTongaTrinidad and TobagoTunisiaTurkeyTuvaluUgandaUkraineUnited KingdomUnited StatesUpper middle incomeUruguayVanuatuVenezuela, RBVietnamWest Bank and GazaWorldYemen, Rep.ZambiaZimbabwe La ligne de temps
Cette échelle de temps montre un graphique de 1977 année à 2016 année Seychelles. Les données jusqu'à 1976 année ne sont pas présentés. Quantité d'observations actuelles selon dates: 40.
Source (désignation):
Les indicateurs du développement mondiale
Source (organisation):
International Monetary Fund, Balance of Payments Statistics Yearbook and data files.
Catégories:
Economy & Growth, Trade
Dernière mise à jour
23 avr. 2017
Les indicateurs de changement de valeurs selon les années
Minimum:
43.982 mln.
1 janv. 1977
Maximum:
1.584 mds
1 janv. 2015
Pour la date d''observation
Valeur
Changement absolu
Le changement par rapport à la valeur précédente
1 janv. 1977
43.982 mln.
+43.982 mln.
0.0%
1 janv. 1978
60.353 mln.
+16.37 mln.
37.22%
1 janv. 1979
79.698 mln.
+19.345 mln.
32.05%
1 janv. 1980
107.314 mln.
+27.616 mln.
34.65%
1 janv. 1981
123.763 mln.
+16.449 mln.
15.33%
1 janv. 1982
119.689 mln.
-4.074 mln.
-3.29%
1 janv. 1983
124.836 mln.
+5.147 mln.
4.3%
1 janv. 1984
114.576 mln.
-10.26 mln.
-8.22%
1 janv. 1985
120.3 mln.
+5.723 mln.
5.0%
1 janv. 1986
143.411 mln.
+23.111 mln.
19.21%
1 janv. 1987
163.872 mln.
+20.461 mln.
14.27%
1 janv. 1988
181.309 mln.
+17.437 mln.
10.64%
1 janv. 1989
216.576 mln.
+35.267 mln.
19.45%
1 janv. 1990
219.711 mln.
+3.136 mln.
1.45%
1 janv. 1991
246.865 mln.
+27.153 mln.
12.36%
1 janv. 1992
230.64 mln.
-16.224 mln.
-6.57%
1 janv. 1993
257.084 mln.
+26.444 mln.
11.47%
1 janv. 1994
302.999 mln.
+45.915 mln.
17.86%
1 janv. 1995
268.247 mln.
-34.752 mln.
-11.47%
1 janv. 1996
317.738 mln.
+49.491 mln.
18.45%
1 janv. 1997
381.05 mln.
+63.312 mln.
19.93%
1 janv. 1998
431.114 mln.
+50.064 mln.
13.14%
1 janv. 1999
466.805 mln.
+35.69 mln.
8.28%
1 janv. 2000
525.733 mln.
+58.928 mln.
12.62%
1 janv. 2001
501.836 mln.
-23.896 mln.
-4.55%
1 janv. 2002
644.203 mln.
+142.367 mln.
28.37%
1 janv. 2003
596.835 mln.
-47.368 mln.
-7.35%
1 janv. 2004
595.787 mln.
-1.048 mln.
-0.18%
1 janv. 2005
672.105 mln.
+76.318 mln.
12.81%
1 janv. 2006
884.894 mln.
+212.789 mln.
31.66%
1 janv. 2007
984.508 mln.
+99.614 mln.
11.26%
1 janv. 2008
948.655 mln.
-35.853 mln.
-3.64%
1 janv. 2009
1.084 mds
+135.719 mln.
14.31%
1 janv. 2010
991.542 mln.
-92.833 mln.
-8.56%
1 janv. 2011
1.048 mds
+56.178 mln.
5.67%
1 janv. 2012
1.181 mds
+133.206 mln.
12.71%
1 janv. 2013
1.415 mds
+234.158 mln.
19.83%
1 janv. 2014
1.547 mds
+131.816 mln.
9.32%
1 janv. 2015
1.584 mds
+37.114 mln.
2.4%
1 janv. 2016
1.421 mds
-163.141 mln.
-10.3%
Classement des pays selon les statistiques actuelles par années


Commentaires: