29
/fr/
fr
AIzaSyAYiBZKx7MnpbEhh9jyipgxe19OcubqV5w
April 1, 2024
279910
Vanuatu
VUT
true
2
1
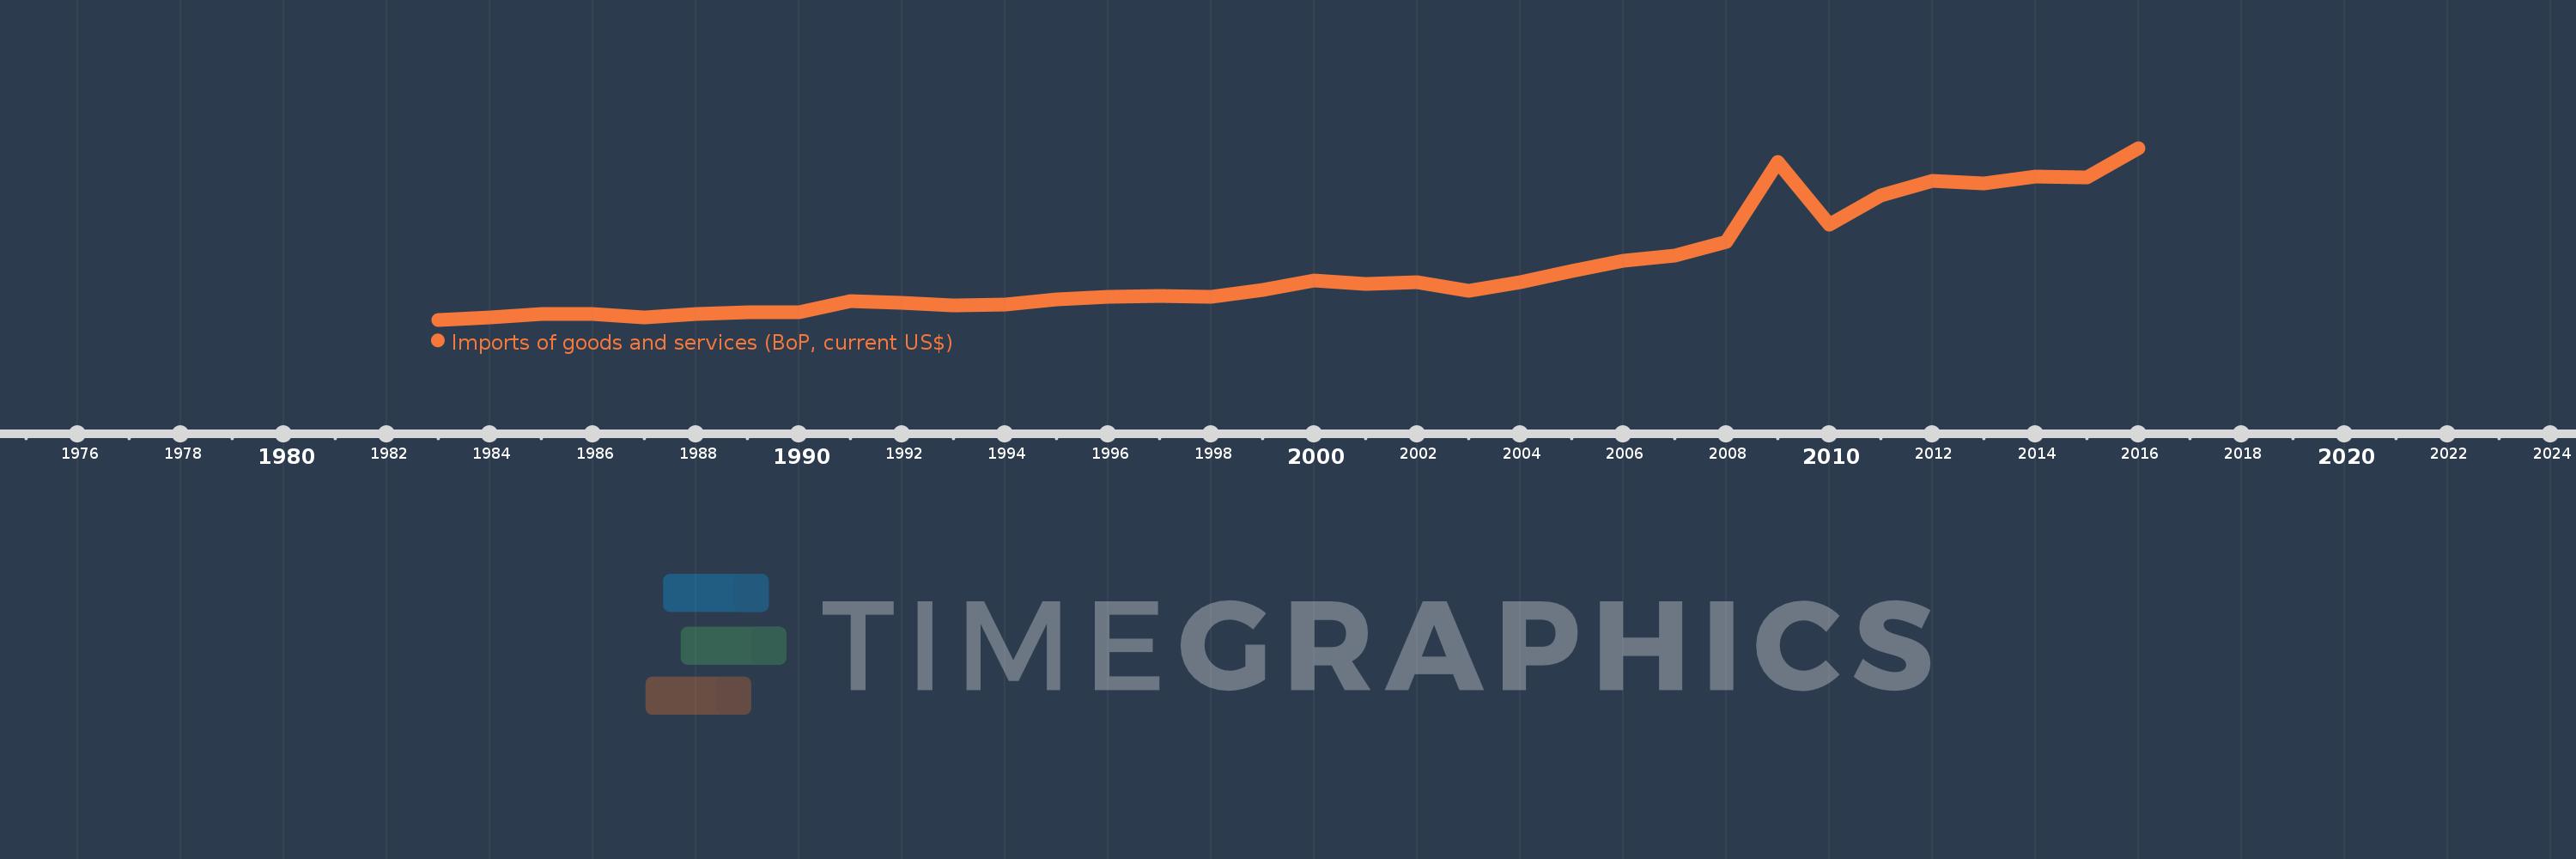
Imports of goods and services (BoP, current US$)
2016,2015,2014,2013,2012,2011,2010,2009,2008,2007,2006,2005,2004,2003,2002,2001,2000,1999,1998,1997,1996,1995,1994,1993,1992,1991,1990,1989,1988,1987,1986,1985,1984,1983
Cette statistique dans les autres pays:
AfghanistanAlbaniaAlgeriaAngolaAntigua and BarbudaArab WorldArgentinaArmeniaArubaAustraliaAustriaAzerbaijanBahamas, TheBahrainBangladeshBarbadosBelarusBelgiumBelizeBeninBermudaBhutanBoliviaBosnia and HerzegovinaBotswanaBrazilBrunei DarussalamBulgariaBurkina FasoBurundiCabo VerdeCambodiaCameroonCanadaCaribbean small statesCentral African RepublicCentral Europe and the BalticsChadChileChinaColombiaComorosCongo, Dem. Rep.Congo, Rep.Costa RicaCote d'IvoireCroatiaCuracaoCyprusCzech RepublicDenmarkDjiboutiDominicaDominican RepublicEarly-demographic dividendEast Asia & PacificEast Asia & Pacific (excluding high income)East Asia & Pacific (IDA & IBRD countries)EcuadorEgypt, Arab Rep.El SalvadorEquatorial GuineaEritreaEstoniaEthiopiaEuro areaEurope & Central AsiaEurope & Central Asia (excluding high income)Europe & Central Asia (IDA & IBRD countries)European UnionFaroe IslandsFijiFinlandFragile and conflict affected situationsFranceFrench PolynesiaGabonGambia, TheGeorgiaGermanyGhanaGreeceGrenadaGuatemalaGuineaGuinea-BissauGuyanaHaitiHeavily indebted poor countries (HIPC)High incomeHondurasHong Kong SAR, ChinaHungaryIBRD onlyIcelandIDA & IBRD totalIDA blendIDA onlyIDA totalIndiaIndonesiaIran, Islamic Rep.IraqIrelandIsraelItalyJamaicaJapanJordanKazakhstanKenyaKiribatiKorea, Rep.KosovoKuwaitKyrgyz RepublicLao PDRLate-demographic dividendLatin America & Caribbean Latin America & Caribbean (excluding high income)Latin America & the Caribbean (IDA & IBRD countries)LatviaLeast developed countries: UN classificationLebanonLesothoLiberiaLibyaLithuaniaLow & middle incomeLow incomeLower middle incomeLuxembourgMacao SAR, ChinaMacedonia, FYRMadagascarMalawiMalaysiaMaldivesMaliMaltaMarshall IslandsMauritaniaMauritiusMexicoMicronesia, Fed. Sts.Middle East & North Africa (excluding high income)Middle East & North Africa (IDA & IBRD countries)Middle incomeMoldovaMongoliaMontenegroMoroccoMozambiqueMyanmarNamibiaNepalNetherlandsNew CaledoniaNicaraguaNigerNigeriaNorth AmericaNorwayOECD membersOmanOther small statesPacific island small statesPakistanPalauPanamaPapua New GuineaParaguayPeruPhilippinesPolandPortugalPost-demographic dividendPre-demographic dividendQatarRomaniaRussian FederationRwandaSamoaSao Tome and PrincipeSaudi ArabiaSenegalSerbiaSeychellesSierra LeoneSingaporeSint Maarten (Dutch part)Slovak RepublicSloveniaSmall statesSolomon IslandsSouth AfricaSouth AsiaSouth Asia (IDA & IBRD)South SudanSpainSri LankaSt. Kitts and NevisSt. LuciaSt. Vincent and the GrenadinesSub-Saharan Africa Sub-Saharan Africa (excluding high income)Sub-Saharan Africa (IDA & IBRD countries)SudanSurinameSwazilandSwedenSwitzerlandSyrian Arab RepublicTajikistanTanzaniaThailandTimor-LesteTogoTongaTrinidad and TobagoTunisiaTurkeyTuvaluUgandaUkraineUnited KingdomUnited StatesUpper middle incomeUruguayVanuatuVenezuela, RBVietnamWest Bank and GazaWorldYemen, Rep.ZambiaZimbabwe La ligne de temps
Cette échelle de temps montre un graphique de 1983 année à 2016 année Vanuatu. Les données jusqu'à 1982 année ne sont pas présentés. Quantité d'observations actuelles selon dates: 34.
Source (désignation):
Les indicateurs du développement mondiale
Source (organisation):
International Monetary Fund, Balance of Payments Statistics Yearbook and data files.
Catégories:
Economy & Growth, Trade
Dernière mise à jour
23 avr. 2017
Les indicateurs de changement de valeurs selon les années
Minimum:
57.625 mln.
1 janv. 1983
Maximum:
487.013 mln.
1 janv. 2016
Pour la date d''observation
Valeur
Changement absolu
Le changement par rapport à la valeur précédente
1 janv. 1983
57.625 mln.
+57.625 mln.
0.0%
1 janv. 1984
62.636 mln.
+5.011 mln.
8.7%
1 janv. 1985
71.549 mln.
+8.913 mln.
14.23%
1 janv. 1986
72.657 mln.
+1.108 mln.
1.55%
1 janv. 1987
62.606 mln.
-10.051 mln.
-13.83%
1 janv. 1988
72.682 mln.
+10.076 mln.
16.09%
1 janv. 1989
75.677 mln.
+2.995 mln.
4.12%
1 janv. 1990
77.034 mln.
+1.357 mln.
1.79%
1 janv. 1991
103.196 mln.
+26.162 mln.
33.96%
1 janv. 1992
100.959 mln.
-2.237 mln.
-2.17%
1 janv. 1993
93.578 mln.
-7.381 mln.
-7.31%
1 janv. 1994
94.677 mln.
+1.099 mln.
1.17%
1 janv. 1995
108.119 mln.
+13.442 mln.
14.2%
1 janv. 1996
114.709 mln.
+6.59 mln.
6.1%
1 janv. 1997
117.606 mln.
+2.897 mln.
2.53%
1 janv. 1998
114.946 mln.
-2.66 mln.
-2.26%
1 janv. 1999
133.192 mln.
+18.246 mln.
15.87%
1 janv. 2000
156.548 mln.
+23.356 mln.
17.54%
1 janv. 2001
147.087 mln.
-9.46 mln.
-6.04%
1 janv. 2002
150.952 mln.
+3.865 mln.
2.63%
1 janv. 2003
130.005 mln.
-20.947 mln.
-13.88%
1 janv. 2004
152.451 mln.
+22.446 mln.
17.27%
1 janv. 2005
178.577 mln.
+26.125 mln.
17.14%
1 janv. 2006
204.907 mln.
+26.331 mln.
14.74%
1 janv. 2007
218.799 mln.
+13.892 mln.
6.78%
1 janv. 2008
252.156 mln.
+33.357 mln.
15.25%
1 janv. 2009
452.321 mln.
+200.165 mln.
79.38%
1 janv. 2010
295.906 mln.
-156.415 mln.
-34.58%
1 janv. 2011
368.417 mln.
+72.511 mln.
24.5%
1 janv. 2012
404.998 mln.
+36.581 mln.
9.93%
1 janv. 2013
399.162 mln.
-5.837 mln.
-1.44%
1 janv. 2014
416.525 mln.
+17.363 mln.
4.35%
1 janv. 2015
414.256 mln.
-2.269 mln.
-0.54%
1 janv. 2016
487.013 mln.
+72.757 mln.
17.56%
Classement des pays selon les statistiques actuelles par années


Commentaires: