29
/fr/
fr
AIzaSyAYiBZKx7MnpbEhh9jyipgxe19OcubqV5w
April 1, 2024
216554
Pakistan
PAK
true
2
1
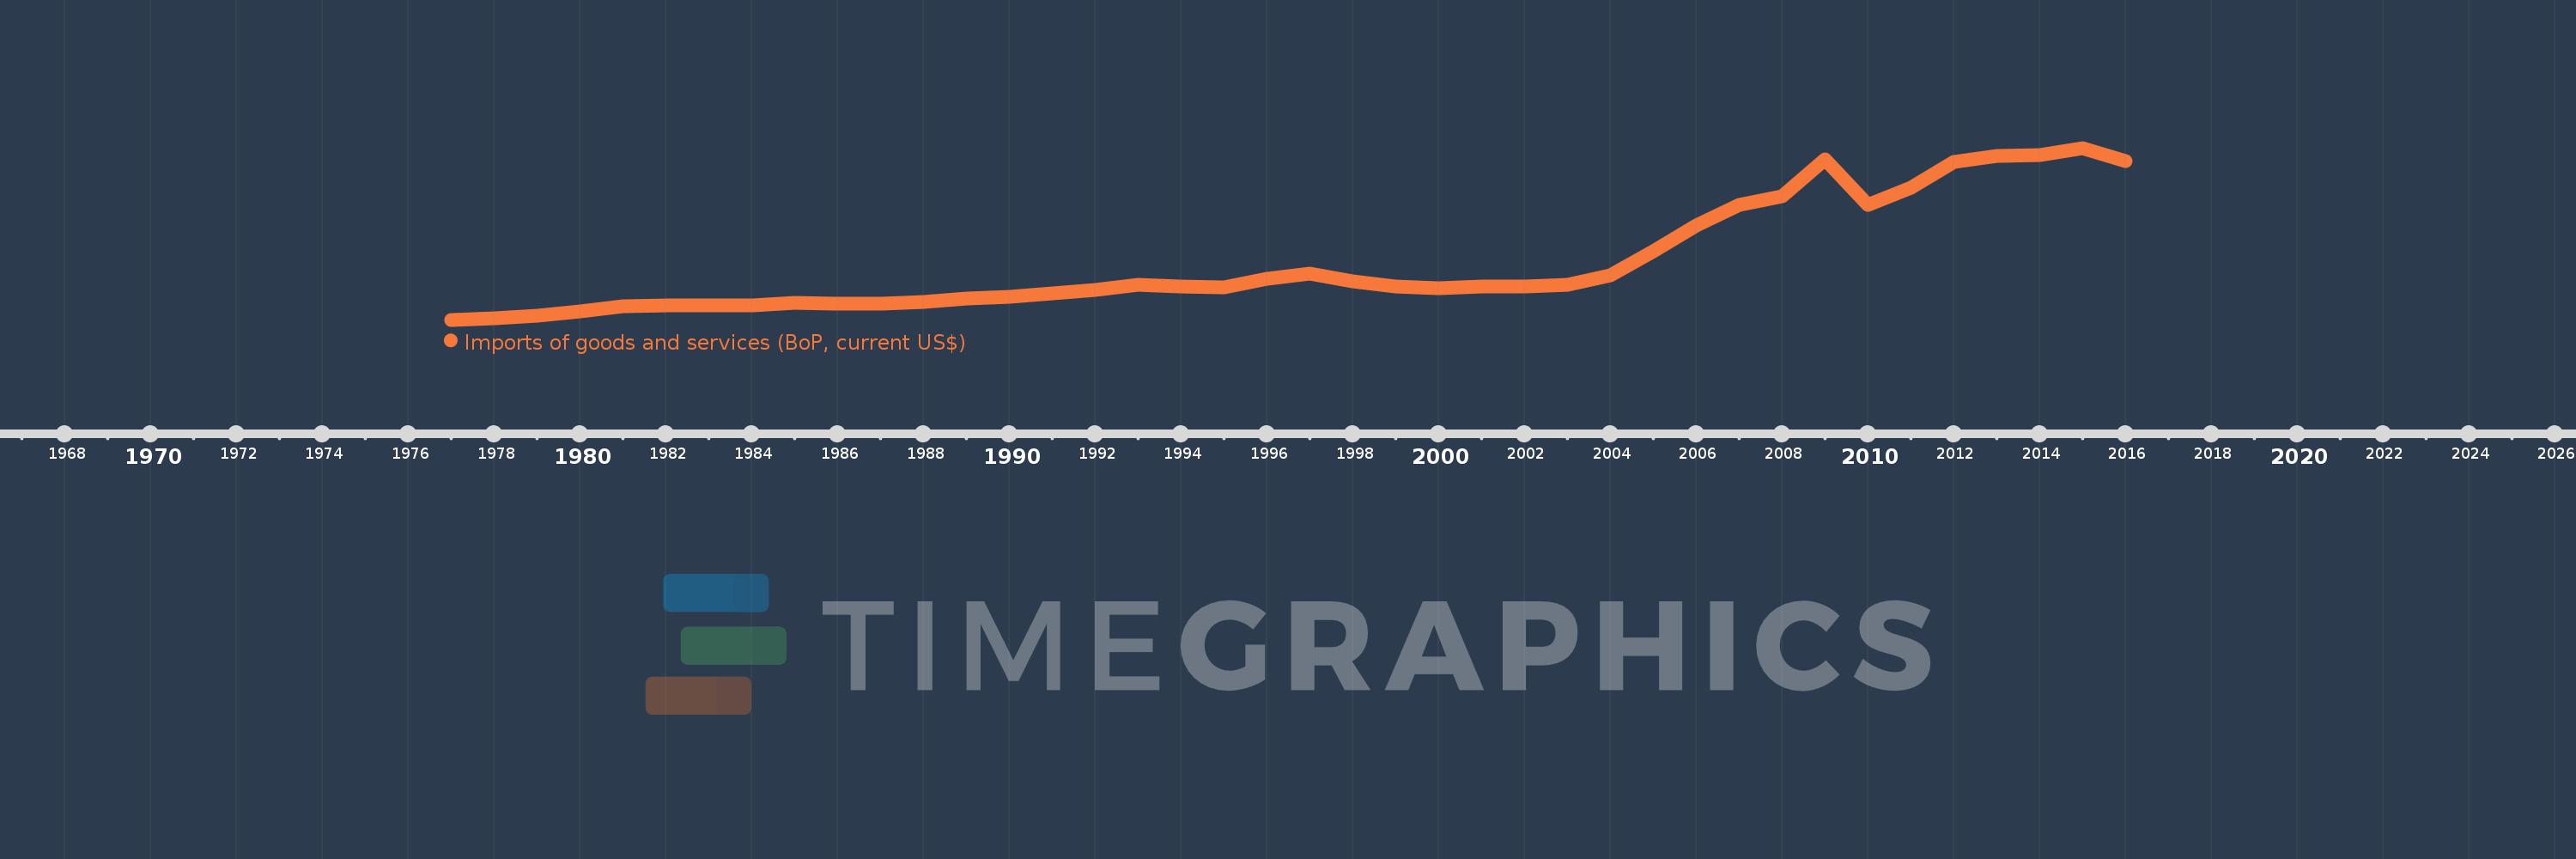
Imports of goods and services (BoP, current US$)
2016,2015,2014,2013,2012,2011,2010,2009,2008,2007,2006,2005,2004,2003,2002,2001,2000,1999,1998,1997,1996,1995,1994,1993,1992,1991,1990,1989,1988,1987,1986,1985,1984,1983,1982,1981,1980,1979,1978,1977
Cette statistique dans les autres pays:
AfghanistanAlbaniaAlgeriaAngolaAntigua and BarbudaArab WorldArgentinaArmeniaArubaAustraliaAustriaAzerbaijanBahamas, TheBahrainBangladeshBarbadosBelarusBelgiumBelizeBeninBermudaBhutanBoliviaBosnia and HerzegovinaBotswanaBrazilBrunei DarussalamBulgariaBurkina FasoBurundiCabo VerdeCambodiaCameroonCanadaCaribbean small statesCentral African RepublicCentral Europe and the BalticsChadChileChinaColombiaComorosCongo, Dem. Rep.Congo, Rep.Costa RicaCote d'IvoireCroatiaCuracaoCyprusCzech RepublicDenmarkDjiboutiDominicaDominican RepublicEarly-demographic dividendEast Asia & PacificEast Asia & Pacific (excluding high income)East Asia & Pacific (IDA & IBRD countries)EcuadorEgypt, Arab Rep.El SalvadorEquatorial GuineaEritreaEstoniaEthiopiaEuro areaEurope & Central AsiaEurope & Central Asia (excluding high income)Europe & Central Asia (IDA & IBRD countries)European UnionFaroe IslandsFijiFinlandFragile and conflict affected situationsFranceFrench PolynesiaGabonGambia, TheGeorgiaGermanyGhanaGreeceGrenadaGuatemalaGuineaGuinea-BissauGuyanaHaitiHeavily indebted poor countries (HIPC)High incomeHondurasHong Kong SAR, ChinaHungaryIBRD onlyIcelandIDA & IBRD totalIDA blendIDA onlyIDA totalIndiaIndonesiaIran, Islamic Rep.IraqIrelandIsraelItalyJamaicaJapanJordanKazakhstanKenyaKiribatiKorea, Rep.KosovoKuwaitKyrgyz RepublicLao PDRLate-demographic dividendLatin America & Caribbean Latin America & Caribbean (excluding high income)Latin America & the Caribbean (IDA & IBRD countries)LatviaLeast developed countries: UN classificationLebanonLesothoLiberiaLibyaLithuaniaLow & middle incomeLow incomeLower middle incomeLuxembourgMacao SAR, ChinaMacedonia, FYRMadagascarMalawiMalaysiaMaldivesMaliMaltaMarshall IslandsMauritaniaMauritiusMexicoMicronesia, Fed. Sts.Middle East & North Africa (excluding high income)Middle East & North Africa (IDA & IBRD countries)Middle incomeMoldovaMongoliaMontenegroMoroccoMozambiqueMyanmarNamibiaNepalNetherlandsNew CaledoniaNicaraguaNigerNigeriaNorth AmericaNorwayOECD membersOmanOther small statesPacific island small statesPakistanPalauPanamaPapua New GuineaParaguayPeruPhilippinesPolandPortugalPost-demographic dividendPre-demographic dividendQatarRomaniaRussian FederationRwandaSamoaSao Tome and PrincipeSaudi ArabiaSenegalSerbiaSeychellesSierra LeoneSingaporeSint Maarten (Dutch part)Slovak RepublicSloveniaSmall statesSolomon IslandsSouth AfricaSouth AsiaSouth Asia (IDA & IBRD)South SudanSpainSri LankaSt. Kitts and NevisSt. LuciaSt. Vincent and the GrenadinesSub-Saharan Africa Sub-Saharan Africa (excluding high income)Sub-Saharan Africa (IDA & IBRD countries)SudanSurinameSwazilandSwedenSwitzerlandSyrian Arab RepublicTajikistanTanzaniaThailandTimor-LesteTogoTongaTrinidad and TobagoTunisiaTurkeyTuvaluUgandaUkraineUnited KingdomUnited StatesUpper middle incomeUruguayVanuatuVenezuela, RBVietnamWest Bank and GazaWorldYemen, Rep.ZambiaZimbabwe La ligne de temps
Cette échelle de temps montre un graphique de 1977 année à 2016 année Pakistan. Les données jusqu'à 1976 année ne sont pas présentés. Quantité d'observations actuelles selon dates: 40.
Source (désignation):
Les indicateurs du développement mondiale
Source (organisation):
International Monetary Fund, Balance of Payments Statistics Yearbook and data files.
Catégories:
Economy & Growth, Trade
Dernière mise à jour
23 avr. 2017
Les indicateurs de changement de valeurs selon les années
Minimum:
2.644 mds
1 janv. 1977
Maximum:
51.119 mds
1 janv. 2015
Pour la date d''observation
Valeur
Changement absolu
Le changement par rapport à la valeur précédente
1 janv. 1977
2.644 mds
+2.644 mds
0.0%
1 janv. 1978
2.993 mds
+349.626 mln.
13.22%
1 janv. 1979
3.856 mds
+862.242 mln.
28.8%
1 janv. 1980
5.101 mds
+1.245 mds
32.29%
1 janv. 1981
6.348 mds
+1.247 mds
24.45%
1 janv. 1982
6.602 mds
+254.025 mln.
4.0%
1 janv. 1983
6.722 mds
+119.942 mln.
1.82%
1 janv. 1984
6.608 mds
-114.145 mln.
-1.7%
1 janv. 1985
7.356 mds
+748.05 mln.
11.32%
1 janv. 1986
7.09 mds
-265.617 mln.
-3.61%
1 janv. 1987
7.2 mds
+110.202 mln.
1.55%
1 janv. 1988
7.571 mds
+370.626 mln.
5.15%
1 janv. 1989
8.624 mds
+1.053 mds
13.9%
1 janv. 1990
9.113 mds
+489.288 mln.
5.67%
1 janv. 1991
10.205 mds
+1.092 mds
11.99%
1 janv. 1992
10.997 mds
+792.092 mln.
7.76%
1 janv. 1993
12.4 mds
+1.403 mds
12.75%
1 janv. 1994
12.019 mds
-381.3 mln.
-3.08%
1 janv. 1995
11.885 mds
-133.902 mln.
-1.11%
1 janv. 1996
14.185 mds
+2.301 mds
19.36%
1 janv. 1997
15.623 mds
+1.437 mds
10.13%
1 janv. 1998
13.408 mds
-2.214 mds
-14.17%
1 janv. 1999
11.996 mds
-1.412 mds
-10.53%
1 janv. 2000
11.565 mds
-431.0 mln.
-3.59%
1 janv. 2001
12.026 mds
+461.0 mln.
3.99%
1 janv. 2002
11.952 mds
-74.0 mln.
-0.62%
1 janv. 2003
12.566 mds
+614.0 mln.
5.14%
1 janv. 2004
15.21 mds
+2.644 mds
21.04%
1 janv. 2005
22.007 mds
+6.797 mds
44.69%
1 janv. 2006
29.275 mds
+7.268 mds
33.03%
1 janv. 2007
35.098 mds
+5.823 mds
19.89%
1 janv. 2008
37.586 mds
+2.488 mds
7.09%
1 janv. 2009
47.929 mds
+10.343 mds
27.52%
1 janv. 2010
35.151 mds
-12.778 mds
-26.66%
1 janv. 2011
40.016 mds
+4.865 mds
13.84%
1 janv. 2012
47.151 mds
+7.135 mds
17.83%
1 janv. 2013
48.902 mds
+1.751 mds
3.71%
1 janv. 2014
49.167 mds
+265.0 mln.
0.54%
1 janv. 2015
51.119 mds
+1.952 mds
3.97%
1 janv. 2016
47.53 mds
-3.589 mds
-7.02%
Classement des pays selon les statistiques actuelles par années


Commentaires: