29
/fr/
fr
AIzaSyAYiBZKx7MnpbEhh9jyipgxe19OcubqV5w
April 1, 2024
133261
Finland
FIN
true
2
1
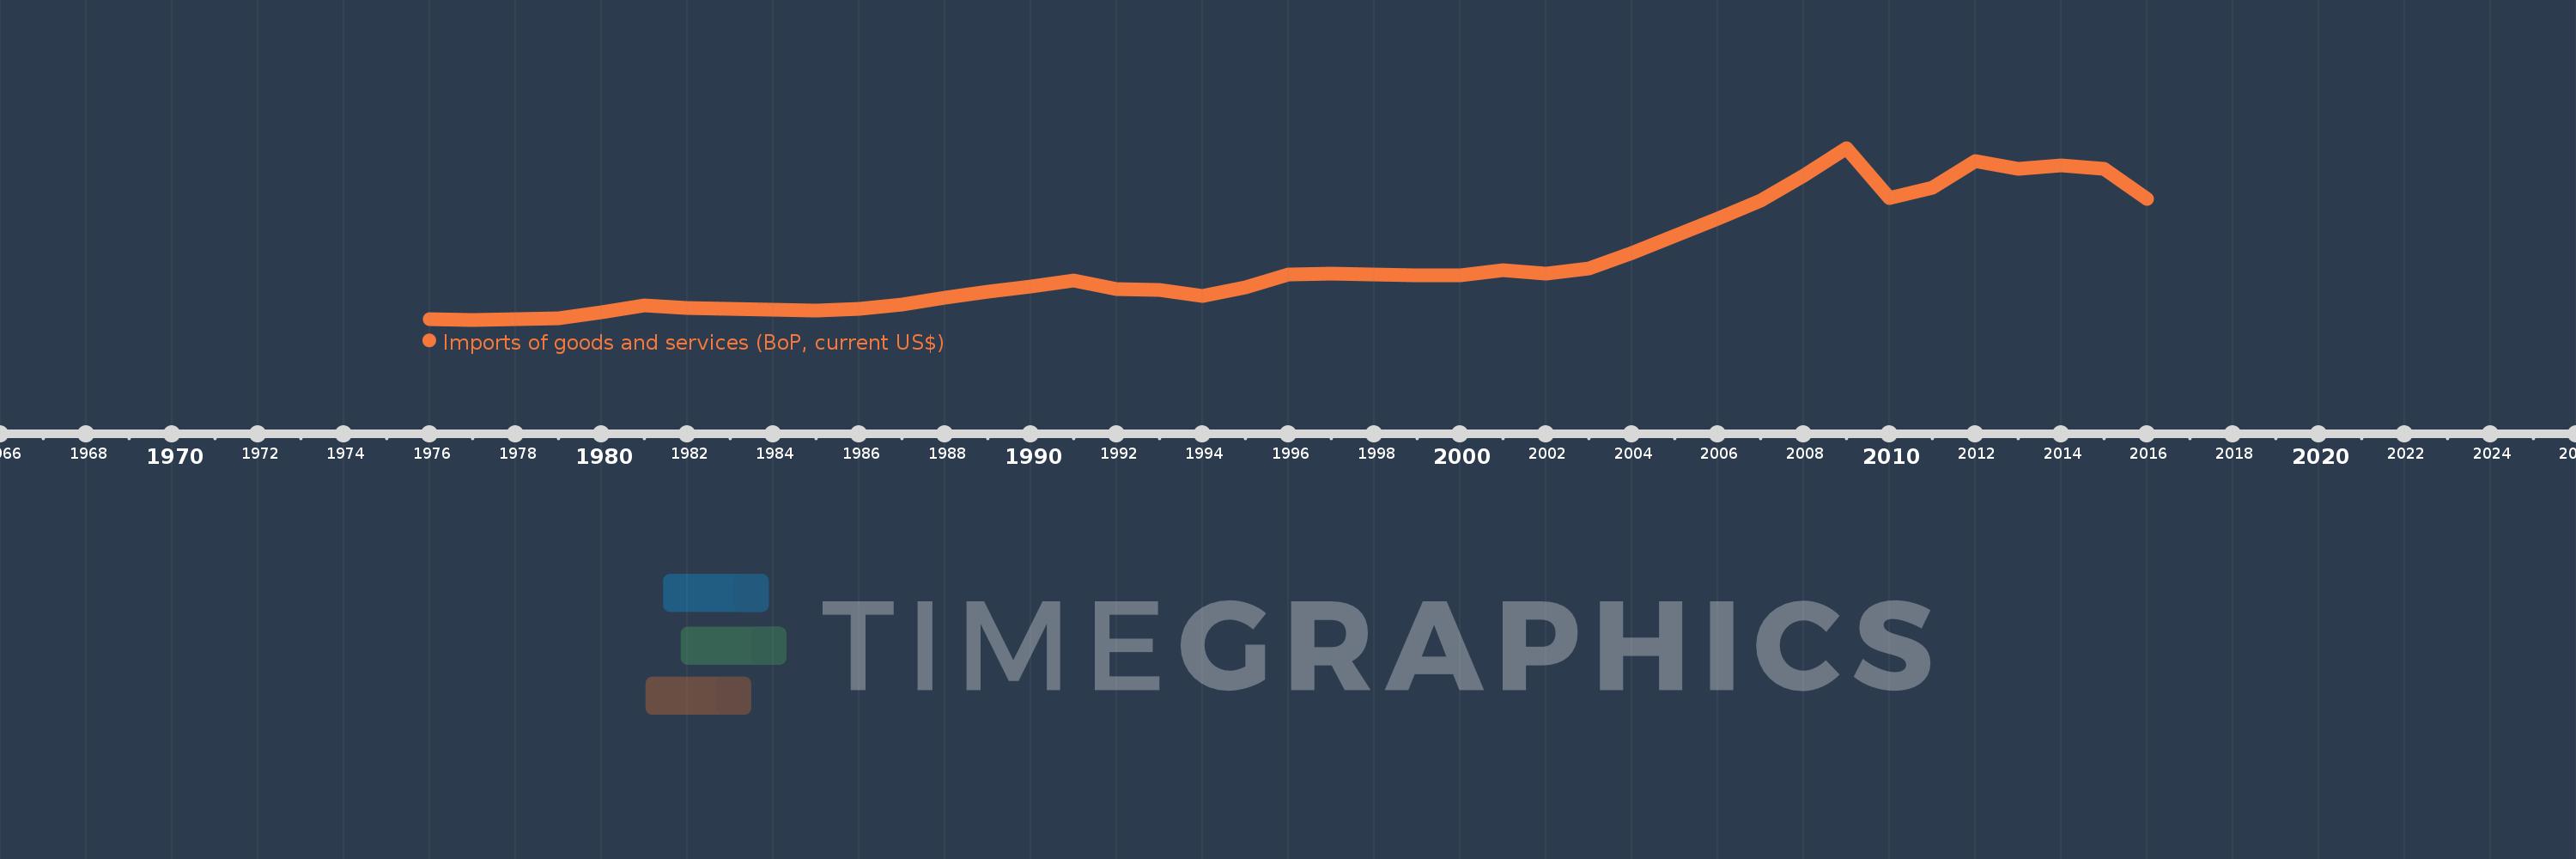
Imports of goods and services (BoP, current US$)
2016,2015,2014,2013,2012,2011,2010,2009,2008,2007,2006,2005,2004,2003,2002,2001,2000,1999,1998,1997,1996,1995,1994,1993,1992,1991,1990,1989,1988,1987,1986,1985,1984,1983,1982,1981,1980,1979,1978,1977,1976
Cette statistique dans les autres pays:
AfghanistanAlbaniaAlgeriaAngolaAntigua and BarbudaArab WorldArgentinaArmeniaArubaAustraliaAustriaAzerbaijanBahamas, TheBahrainBangladeshBarbadosBelarusBelgiumBelizeBeninBermudaBhutanBoliviaBosnia and HerzegovinaBotswanaBrazilBrunei DarussalamBulgariaBurkina FasoBurundiCabo VerdeCambodiaCameroonCanadaCaribbean small statesCentral African RepublicCentral Europe and the BalticsChadChileChinaColombiaComorosCongo, Dem. Rep.Congo, Rep.Costa RicaCote d'IvoireCroatiaCuracaoCyprusCzech RepublicDenmarkDjiboutiDominicaDominican RepublicEarly-demographic dividendEast Asia & PacificEast Asia & Pacific (excluding high income)East Asia & Pacific (IDA & IBRD countries)EcuadorEgypt, Arab Rep.El SalvadorEquatorial GuineaEritreaEstoniaEthiopiaEuro areaEurope & Central AsiaEurope & Central Asia (excluding high income)Europe & Central Asia (IDA & IBRD countries)European UnionFaroe IslandsFijiFinlandFragile and conflict affected situationsFranceFrench PolynesiaGabonGambia, TheGeorgiaGermanyGhanaGreeceGrenadaGuatemalaGuineaGuinea-BissauGuyanaHaitiHeavily indebted poor countries (HIPC)High incomeHondurasHong Kong SAR, ChinaHungaryIBRD onlyIcelandIDA & IBRD totalIDA blendIDA onlyIDA totalIndiaIndonesiaIran, Islamic Rep.IraqIrelandIsraelItalyJamaicaJapanJordanKazakhstanKenyaKiribatiKorea, Rep.KosovoKuwaitKyrgyz RepublicLao PDRLate-demographic dividendLatin America & Caribbean Latin America & Caribbean (excluding high income)Latin America & the Caribbean (IDA & IBRD countries)LatviaLeast developed countries: UN classificationLebanonLesothoLiberiaLibyaLithuaniaLow & middle incomeLow incomeLower middle incomeLuxembourgMacao SAR, ChinaMacedonia, FYRMadagascarMalawiMalaysiaMaldivesMaliMaltaMarshall IslandsMauritaniaMauritiusMexicoMicronesia, Fed. Sts.Middle East & North Africa (excluding high income)Middle East & North Africa (IDA & IBRD countries)Middle incomeMoldovaMongoliaMontenegroMoroccoMozambiqueMyanmarNamibiaNepalNetherlandsNew CaledoniaNicaraguaNigerNigeriaNorth AmericaNorwayOECD membersOmanOther small statesPacific island small statesPakistanPalauPanamaPapua New GuineaParaguayPeruPhilippinesPolandPortugalPost-demographic dividendPre-demographic dividendQatarRomaniaRussian FederationRwandaSamoaSao Tome and PrincipeSaudi ArabiaSenegalSerbiaSeychellesSierra LeoneSingaporeSint Maarten (Dutch part)Slovak RepublicSloveniaSmall statesSolomon IslandsSouth AfricaSouth AsiaSouth Asia (IDA & IBRD)South SudanSpainSri LankaSt. Kitts and NevisSt. LuciaSt. Vincent and the GrenadinesSub-Saharan Africa Sub-Saharan Africa (excluding high income)Sub-Saharan Africa (IDA & IBRD countries)SudanSurinameSwazilandSwedenSwitzerlandSyrian Arab RepublicTajikistanTanzaniaThailandTimor-LesteTogoTongaTrinidad and TobagoTunisiaTurkeyTuvaluUgandaUkraineUnited KingdomUnited StatesUpper middle incomeUruguayVanuatuVenezuela, RBVietnamWest Bank and GazaWorldYemen, Rep.ZambiaZimbabwe La ligne de temps
Cette échelle de temps montre un graphique de 1976 année à 2016 année Finland. Les données jusqu'à 1975 année ne sont pas présentés. Quantité d'observations actuelles selon dates: 41.
Source (désignation):
Les indicateurs du développement mondiale
Source (organisation):
International Monetary Fund, Balance of Payments Statistics Yearbook and data files.
Catégories:
Economy & Growth, Trade
Dernière mise à jour
23 avr. 2017
Les indicateurs de changement de valeurs selon les années
Minimum:
8.187 mds
1 janv. 1977
Maximum:
117.847 mds
1 janv. 2009
Pour la date d''observation
Valeur
Changement absolu
Le changement par rapport à la valeur précédente
1 janv. 1976
8.345 mds
+8.345 mds
0.0%
1 janv. 1977
8.187 mds
-157.998 mln.
-1.89%
1 janv. 1978
8.558 mds
+371.674 mln.
4.54%
1 janv. 1979
9.041 mds
+482.432 mln.
5.64%
1 janv. 1980
12.765 mds
+3.724 mds
41.19%
1 janv. 1981
17.307 mds
+4.543 mds
35.59%
1 janv. 1982
15.911 mds
-1.397 mds
-8.07%
1 janv. 1983
15.164 mds
-747.056 mln.
-4.7%
1 janv. 1984
14.54 mds
-623.51 mln.
-4.11%
1 janv. 1985
14.279 mds
-260.91 mln.
-1.79%
1 janv. 1986
15.401 mds
+1.122 mds
7.86%
1 janv. 1987
17.747 mds
+2.345 mds
15.23%
1 janv. 1988
22.257 mds
+4.51 mds
25.41%
1 janv. 1989
26.235 mds
+3.979 mds
17.88%
1 janv. 1990
29.379 mds
+3.143 mds
11.98%
1 janv. 1991
33.122 mds
+3.743 mds
12.74%
1 janv. 1992
27.932 mds
-5.189 mds
-15.67%
1 janv. 1993
27.229 mds
-703.324 mln.
-2.52%
1 janv. 1994
23.541 mds
-3.688 mds
-13.55%
1 janv. 1995
29.061 mds
+5.52 mds
23.45%
1 janv. 1996
36.904 mds
+7.842 mds
26.99%
1 janv. 1997
37.443 mds
+539.705 mln.
1.46%
1 janv. 1998
37.118 mds
-325.691 mln.
-0.87%
1 janv. 1999
36.703 mds
-414.636 mln.
-1.12%
1 janv. 2000
36.679 mds
-23.823 mln.
-0.06%
1 janv. 2001
39.809 mds
+3.129 mds
8.53%
1 janv. 2002
37.795 mds
-2.013 mds
-5.06%
1 janv. 2003
41.064 mds
+3.269 mds
8.65%
1 janv. 2004
50.944 mds
+9.88 mds
24.06%
1 janv. 2005
61.866 mds
+10.923 mds
21.44%
1 janv. 2006
72.638 mds
+10.772 mds
17.41%
1 janv. 2007
84.357 mds
+11.719 mds
16.13%
1 janv. 2008
99.912 mds
+15.555 mds
18.44%
1 janv. 2009
117.847 mds
+17.935 mds
17.95%
1 janv. 2010
86.071 mds
-31.776 mds
-26.96%
1 janv. 2011
92.537 mds
+6.466 mds
7.51%
1 janv. 2012
109.279 mds
+16.742 mds
18.09%
1 janv. 2013
104.737 mds
-4.542 mds
-4.16%
1 janv. 2014
106.617 mds
+1.88 mds
1.8%
1 janv. 2015
104.538 mds
-2.079 mds
-1.95%
1 janv. 2016
85.275 mds
-19.262 mds
-18.43%
Classement des pays selon les statistiques actuelles par années


Commentaires: