29
/fr/
fr
AIzaSyAYiBZKx7MnpbEhh9jyipgxe19OcubqV5w
April 1, 2024
127973
Eritrea
ERI
true
2
1
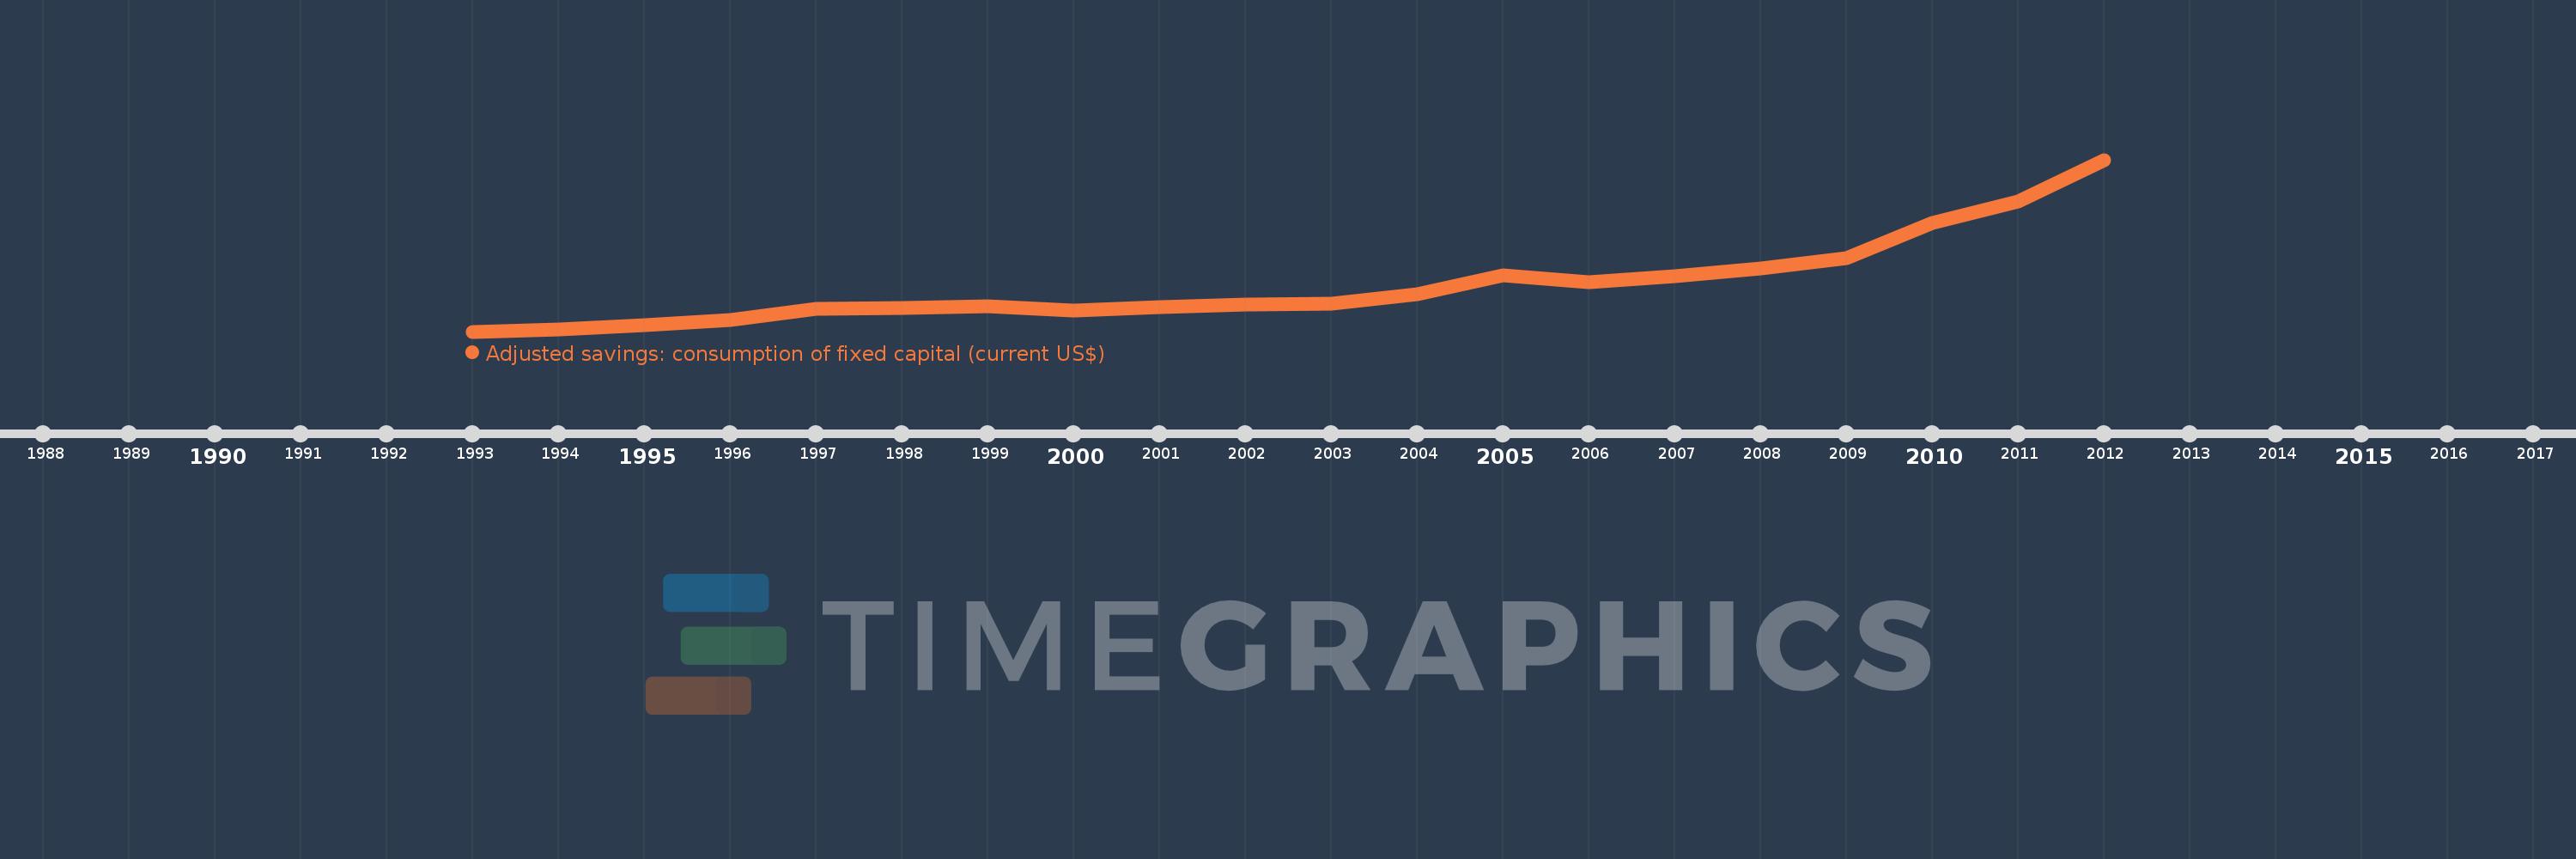
Adjusted savings: consumption of fixed capital (current US$)
2012,2011,2010,2009,2008,2007,2006,2005,2004,2003,2002,2001,2000,1999,1998,1997,1996,1995,1994,1993
Cette statistique dans les autres pays:
AfghanistanAlbaniaAlgeriaAndorraAngolaAntigua and BarbudaArgentinaArmeniaArubaAustraliaAustriaAzerbaijanBahamas, TheBahrainBangladeshBarbadosBelarusBelgiumBelizeBeninBermudaBhutanBoliviaBosnia and HerzegovinaBotswanaBrazilBrunei DarussalamBulgariaBurkina FasoBurundiCabo VerdeCambodiaCameroonCanadaCayman IslandsCentral African RepublicChadChannel IslandsChileChinaColombiaComorosCongo, Dem. Rep.Congo, Rep.Costa RicaCote d'IvoireCroatiaCubaCyprusCzech RepublicDenmarkDjiboutiDominicaDominican RepublicEcuadorEgypt, Arab Rep.El SalvadorEquatorial GuineaEritreaEstoniaEthiopiaFaroe IslandsFijiFinlandFranceFrench PolynesiaGabonGambia, TheGeorgiaGermanyGhanaGreeceGreenlandGrenadaGuatemalaGuineaGuinea-BissauGuyanaHaitiHondurasHong Kong SAR, ChinaHungaryIcelandIndiaIndonesiaIran, Islamic Rep.IraqIrelandIsle of ManIsraelItalyJamaicaJapanJordanKazakhstanKenyaKiribatiKorea, Rep.KosovoKuwaitKyrgyz RepublicLao PDRLatviaLebanonLesothoLiberiaLibyaLiechtensteinLithuaniaLuxembourgMacao SAR, ChinaMacedonia, FYRMadagascarMalawiMalaysiaMaldivesMaliMaltaMarshall IslandsMauritaniaMauritiusMexicoMicronesia, Fed. Sts.MoldovaMonacoMongoliaMontenegroMoroccoMozambiqueMyanmarNamibiaNepalNetherlandsNew CaledoniaNew ZealandNicaraguaNigerNigeriaNorwayOmanPakistanPalauPanamaPapua New GuineaParaguayPeruPhilippinesPolandPortugalPuerto RicoQatarRomaniaRussian FederationRwandaSamoaSan MarinoSao Tome and PrincipeSaudi ArabiaSenegalSerbiaSeychellesSierra LeoneSingaporeSlovak RepublicSloveniaSolomon IslandsSomaliaSouth AfricaSouth SudanSpainSri LankaSt. Kitts and NevisSt. LuciaSt. Vincent and the GrenadinesSudanSurinameSwazilandSwedenSwitzerlandSyrian Arab RepublicTajikistanTanzaniaThailandTimor-LesteTogoTongaTrinidad and TobagoTunisiaTurkeyTurkmenistanTuvaluUgandaUkraineUnited Arab EmiratesUnited KingdomUnited StatesUruguayUzbekistanVanuatuVenezuela, RBVietnamVirgin Islands (U.S.)West Bank and GazaYemen, Rep.ZambiaZimbabwe La ligne de temps
Cette échelle de temps montre un graphique de 1993 année à 2012 année Eritrea. Les données jusqu'à 1992 année ne sont pas présentés. Quantité d'observations actuelles selon dates: 20.
Source (désignation):
Les indicateurs du développement mondiale
Source (organisation):
World Bank staff estimates using data from the United Nations Statistics Division's National Accounts Statistics.
Catégories:
Economy & Growth, Environment
Dernière mise à jour
23 avr. 2017
Les indicateurs de changement de valeurs selon les années
Minimum:
39.346 mln.
1 janv. 1993
Maximum:
259.129 mln.
1 janv. 2012
Pour la date d''observation
Valeur
Changement absolu
Le changement par rapport à la valeur précédente
1 janv. 1993
39.346 mln.
+39.346 mln.
0.0%
1 janv. 1994
41.765 mln.
+2.419 mln.
6.15%
1 janv. 1995
47.857 mln.
+6.092 mln.
14.59%
1 janv. 1996
54.512 mln.
+6.656 mln.
13.91%
1 janv. 1997
68.193 mln.
+13.681 mln.
25.1%
1 janv. 1998
69.901 mln.
+1.708 mln.
2.5%
1 janv. 1999
71.281 mln.
+1.379 mln.
1.97%
1 janv. 2000
66.105 mln.
-5.176 mln.
-7.26%
1 janv. 2001
70.246 mln.
+4.141 mln.
6.26%
1 janv. 2002
74.488 mln.
+4.242 mln.
6.04%
1 janv. 2003
75.326 mln.
+837.713 milles
1.12%
1 janv. 2004
86.713 mln.
+11.387 mln.
15.12%
1 janv. 2005
110.867 mln.
+24.154 mln.
27.86%
1 janv. 2006
102.877 mln.
-7.991 mln.
-7.21%
1 janv. 2007
110.115 mln.
+7.238 mln.
7.04%
1 janv. 2008
120.525 mln.
+10.41 mln.
9.45%
1 janv. 2009
133.584 mln.
+13.059 mln.
10.83%
1 janv. 2010
177.971 mln.
+44.386 mln.
33.23%
1 janv. 2011
205.836 mln.
+27.866 mln.
15.66%
1 janv. 2012
259.129 mln.
+53.293 mln.
25.89%
Classement des pays selon les statistiques actuelles par années


Commentaires: