29
/fr/
fr
AIzaSyAYiBZKx7MnpbEhh9jyipgxe19OcubqV5w
April 1, 2024
99488
Cameroon
CMR
true
2
1
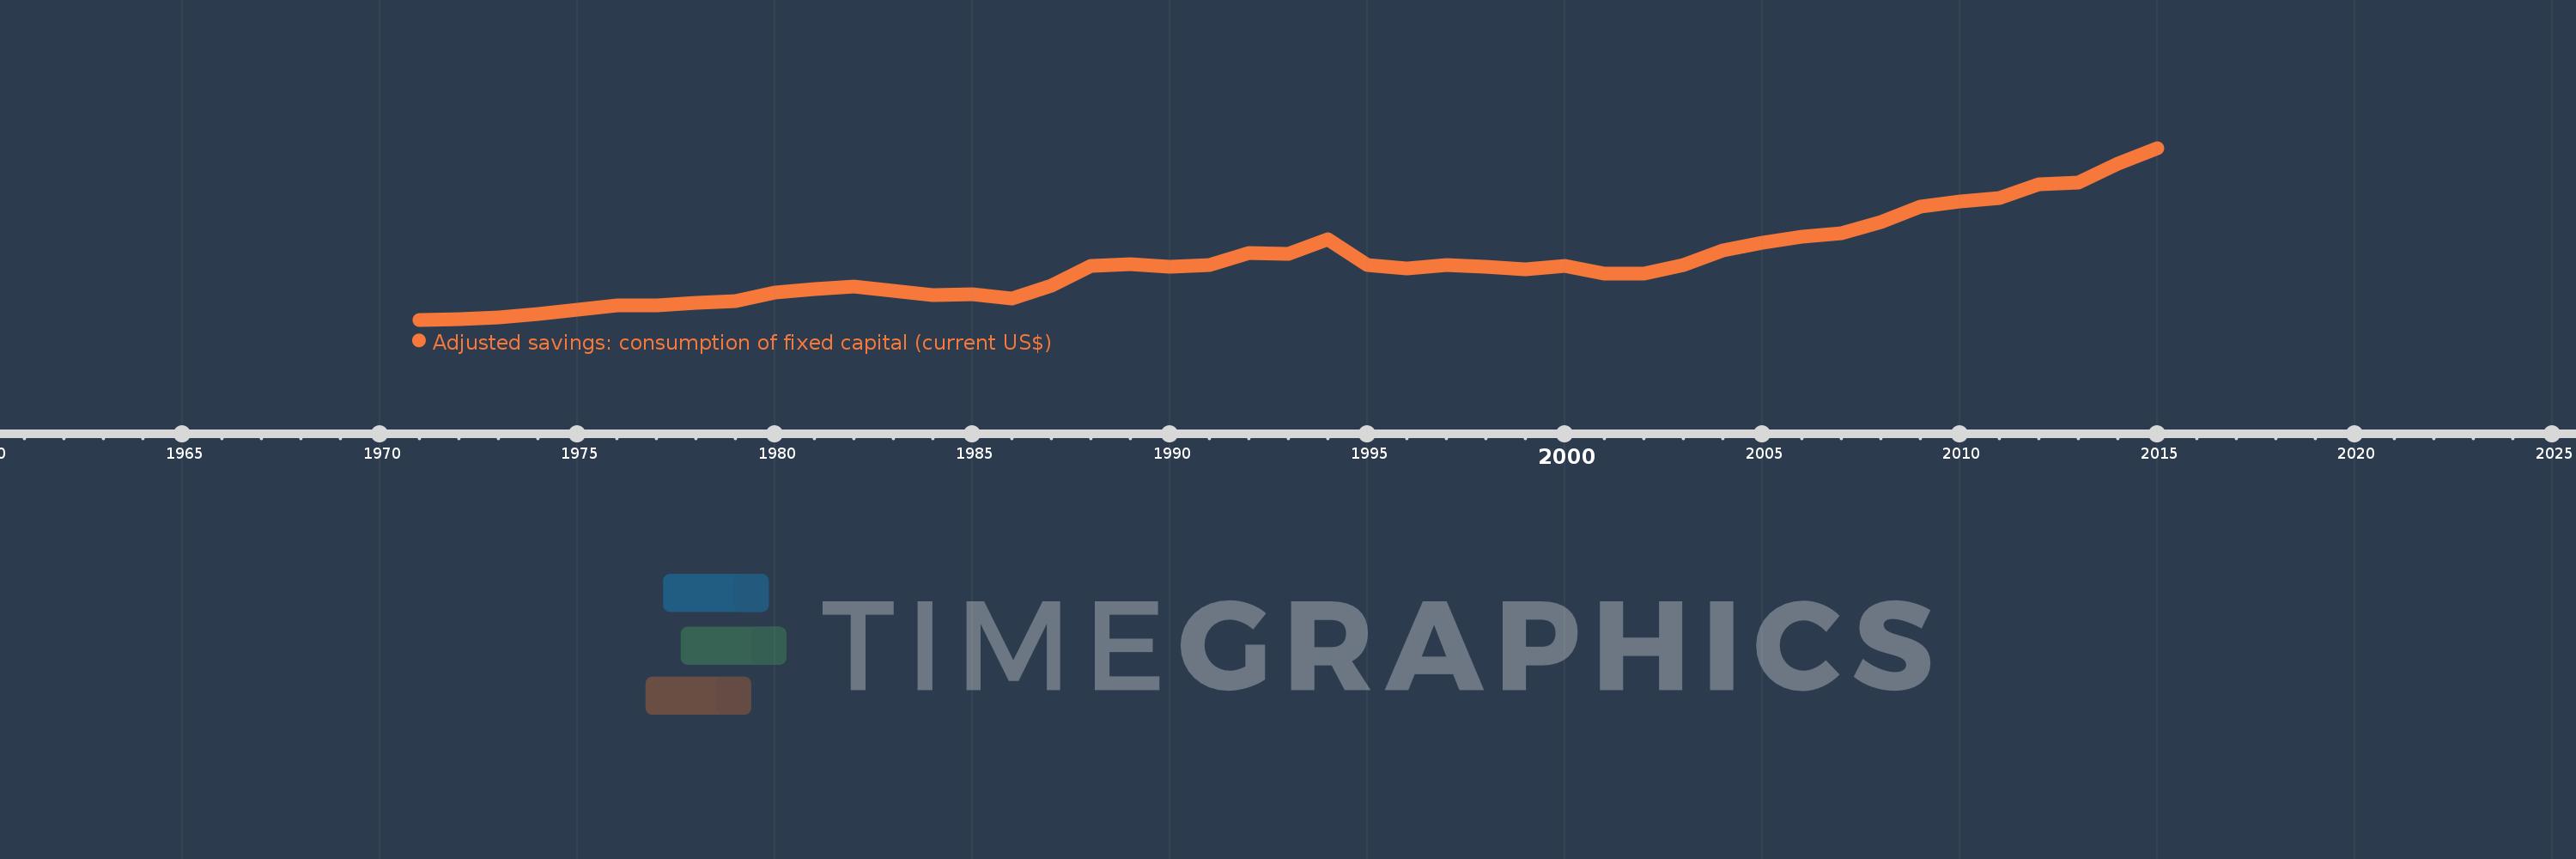
Adjusted savings: consumption of fixed capital (current US$)
2015,2014,2013,2012,2011,2010,2009,2008,2007,2006,2005,2004,2003,2002,2001,2000,1999,1998,1997,1996,1995,1994,1993,1992,1991,1990,1989,1988,1987,1986,1985,1984,1983,1982,1981,1980,1979,1978,1977,1976,1975,1974,1973,1972,1971
Cette statistique dans les autres pays:
AfghanistanAlbaniaAlgeriaAndorraAngolaAntigua and BarbudaArgentinaArmeniaArubaAustraliaAustriaAzerbaijanBahamas, TheBahrainBangladeshBarbadosBelarusBelgiumBelizeBeninBermudaBhutanBoliviaBosnia and HerzegovinaBotswanaBrazilBrunei DarussalamBulgariaBurkina FasoBurundiCabo VerdeCambodiaCameroonCanadaCayman IslandsCentral African RepublicChadChannel IslandsChileChinaColombiaComorosCongo, Dem. Rep.Congo, Rep.Costa RicaCote d'IvoireCroatiaCubaCyprusCzech RepublicDenmarkDjiboutiDominicaDominican RepublicEcuadorEgypt, Arab Rep.El SalvadorEquatorial GuineaEritreaEstoniaEthiopiaFaroe IslandsFijiFinlandFranceFrench PolynesiaGabonGambia, TheGeorgiaGermanyGhanaGreeceGreenlandGrenadaGuatemalaGuineaGuinea-BissauGuyanaHaitiHondurasHong Kong SAR, ChinaHungaryIcelandIndiaIndonesiaIran, Islamic Rep.IraqIrelandIsle of ManIsraelItalyJamaicaJapanJordanKazakhstanKenyaKiribatiKorea, Rep.KosovoKuwaitKyrgyz RepublicLao PDRLatviaLebanonLesothoLiberiaLibyaLiechtensteinLithuaniaLuxembourgMacao SAR, ChinaMacedonia, FYRMadagascarMalawiMalaysiaMaldivesMaliMaltaMarshall IslandsMauritaniaMauritiusMexicoMicronesia, Fed. Sts.MoldovaMonacoMongoliaMontenegroMoroccoMozambiqueMyanmarNamibiaNepalNetherlandsNew CaledoniaNew ZealandNicaraguaNigerNigeriaNorwayOmanPakistanPalauPanamaPapua New GuineaParaguayPeruPhilippinesPolandPortugalPuerto RicoQatarRomaniaRussian FederationRwandaSamoaSan MarinoSao Tome and PrincipeSaudi ArabiaSenegalSerbiaSeychellesSierra LeoneSingaporeSlovak RepublicSloveniaSolomon IslandsSomaliaSouth AfricaSouth SudanSpainSri LankaSt. Kitts and NevisSt. LuciaSt. Vincent and the GrenadinesSudanSurinameSwazilandSwedenSwitzerlandSyrian Arab RepublicTajikistanTanzaniaThailandTimor-LesteTogoTongaTrinidad and TobagoTunisiaTurkeyTurkmenistanTuvaluUgandaUkraineUnited Arab EmiratesUnited KingdomUnited StatesUruguayUzbekistanVanuatuVenezuela, RBVietnamVirgin Islands (U.S.)West Bank and GazaYemen, Rep.ZambiaZimbabwe La ligne de temps
Cette échelle de temps montre un graphique de 1971 année à 2015 année Cameroon. Les données jusqu'à 1970 année ne sont pas présentés. Quantité d'observations actuelles selon dates: 45.
Source (désignation):
Les indicateurs du développement mondiale
Source (organisation):
World Bank staff estimates using data from the United Nations Statistics Division's National Accounts Statistics.
Catégories:
Economy & Growth, Environment
Dernière mise à jour
23 avr. 2017
Les indicateurs de changement de valeurs selon les années
Minimum:
45.138 mln.
1 janv. 1971
Maximum:
2.418 mds
1 janv. 2015
Pour la date d''observation
Valeur
Changement absolu
Le changement par rapport à la valeur précédente
1 janv. 1971
45.138 mln.
+45.138 mln.
0.0%
1 janv. 1972
49.568 mln.
+4.43 mln.
9.81%
1 janv. 1973
82.021 mln.
+32.454 mln.
65.47%
1 janv. 1974
126.809 mln.
+44.787 mln.
54.6%
1 janv. 1975
187.828 mln.
+61.02 mln.
48.12%
1 janv. 1976
240.082 mln.
+52.253 mln.
27.82%
1 janv. 1977
247.296 mln.
+7.214 mln.
3.0%
1 janv. 1978
279.256 mln.
+31.96 mln.
12.92%
1 janv. 1979
306.01 mln.
+26.755 mln.
9.58%
1 janv. 1980
424.524 mln.
+118.514 mln.
38.73%
1 janv. 1981
471.853 mln.
+47.329 mln.
11.15%
1 janv. 1982
503.225 mln.
+31.372 mln.
6.65%
1 janv. 1983
441.611 mln.
-61.614 mln.
-12.24%
1 janv. 1984
380.627 mln.
-60.984 mln.
-13.81%
1 janv. 1985
396.188 mln.
+15.561 mln.
4.09%
1 janv. 1986
340.996 mln.
-55.192 mln.
-13.93%
1 janv. 1987
517.511 mln.
+176.514 mln.
51.76%
1 janv. 1988
787.493 mln.
+269.983 mln.
52.17%
1 janv. 1989
818.648 mln.
+31.155 mln.
3.96%
1 janv. 1990
780.048 mln.
-38.601 mln.
-4.72%
1 janv. 1991
800.273 mln.
+20.225 mln.
2.59%
1 janv. 1992
969.565 mln.
+169.293 mln.
21.15%
1 janv. 1993
955.175 mln.
-14.391 mln.
-1.48%
1 janv. 1994
1.162 mds
+207.247 mln.
21.7%
1 janv. 1995
800.494 mln.
-361.928 mln.
-31.14%
1 janv. 1996
747.987 mln.
-52.506 mln.
-6.56%
1 janv. 1997
800.15 mln.
+52.162 mln.
6.97%
1 janv. 1998
779.039 mln.
-21.111 mln.
-2.64%
1 janv. 1999
736.924 mln.
-42.115 mln.
-5.41%
1 janv. 2000
792.399 mln.
+55.476 mln.
7.53%
1 janv. 2001
687.437 mln.
-104.963 mln.
-13.25%
1 janv. 2002
680.048 mln.
-7.388 mln.
-1.07%
1 janv. 2003
803.396 mln.
+123.347 mln.
18.14%
1 janv. 2004
1.003 mds
+199.872 mln.
24.88%
1 janv. 2005
1.105 mds
+101.308 mln.
10.1%
1 janv. 2006
1.188 mds
+83.075 mln.
7.52%
1 janv. 2007
1.234 mds
+46.713 mln.
3.93%
1 janv. 2008
1.397 mds
+162.905 mln.
13.2%
1 janv. 2009
1.612 mds
+214.544 mln.
15.35%
1 janv. 2010
1.681 mds
+69.442 mln.
4.31%
1 janv. 2011
1.729 mds
+47.868 mln.
2.85%
1 janv. 2012
1.922 mds
+192.716 mln.
11.15%
1 janv. 2013
1.942 mds
+19.672 mln.
1.02%
1 janv. 2014
2.2 mds
+258.304 mln.
13.3%
1 janv. 2015
2.418 mds
+218.663 mln.
9.94%
Classement des pays selon les statistiques actuelles par années


Commentaires: