29
/fr/
fr
AIzaSyAYiBZKx7MnpbEhh9jyipgxe19OcubqV5w
April 1, 2024
136350
Gambia, The
GMB
true
2
1
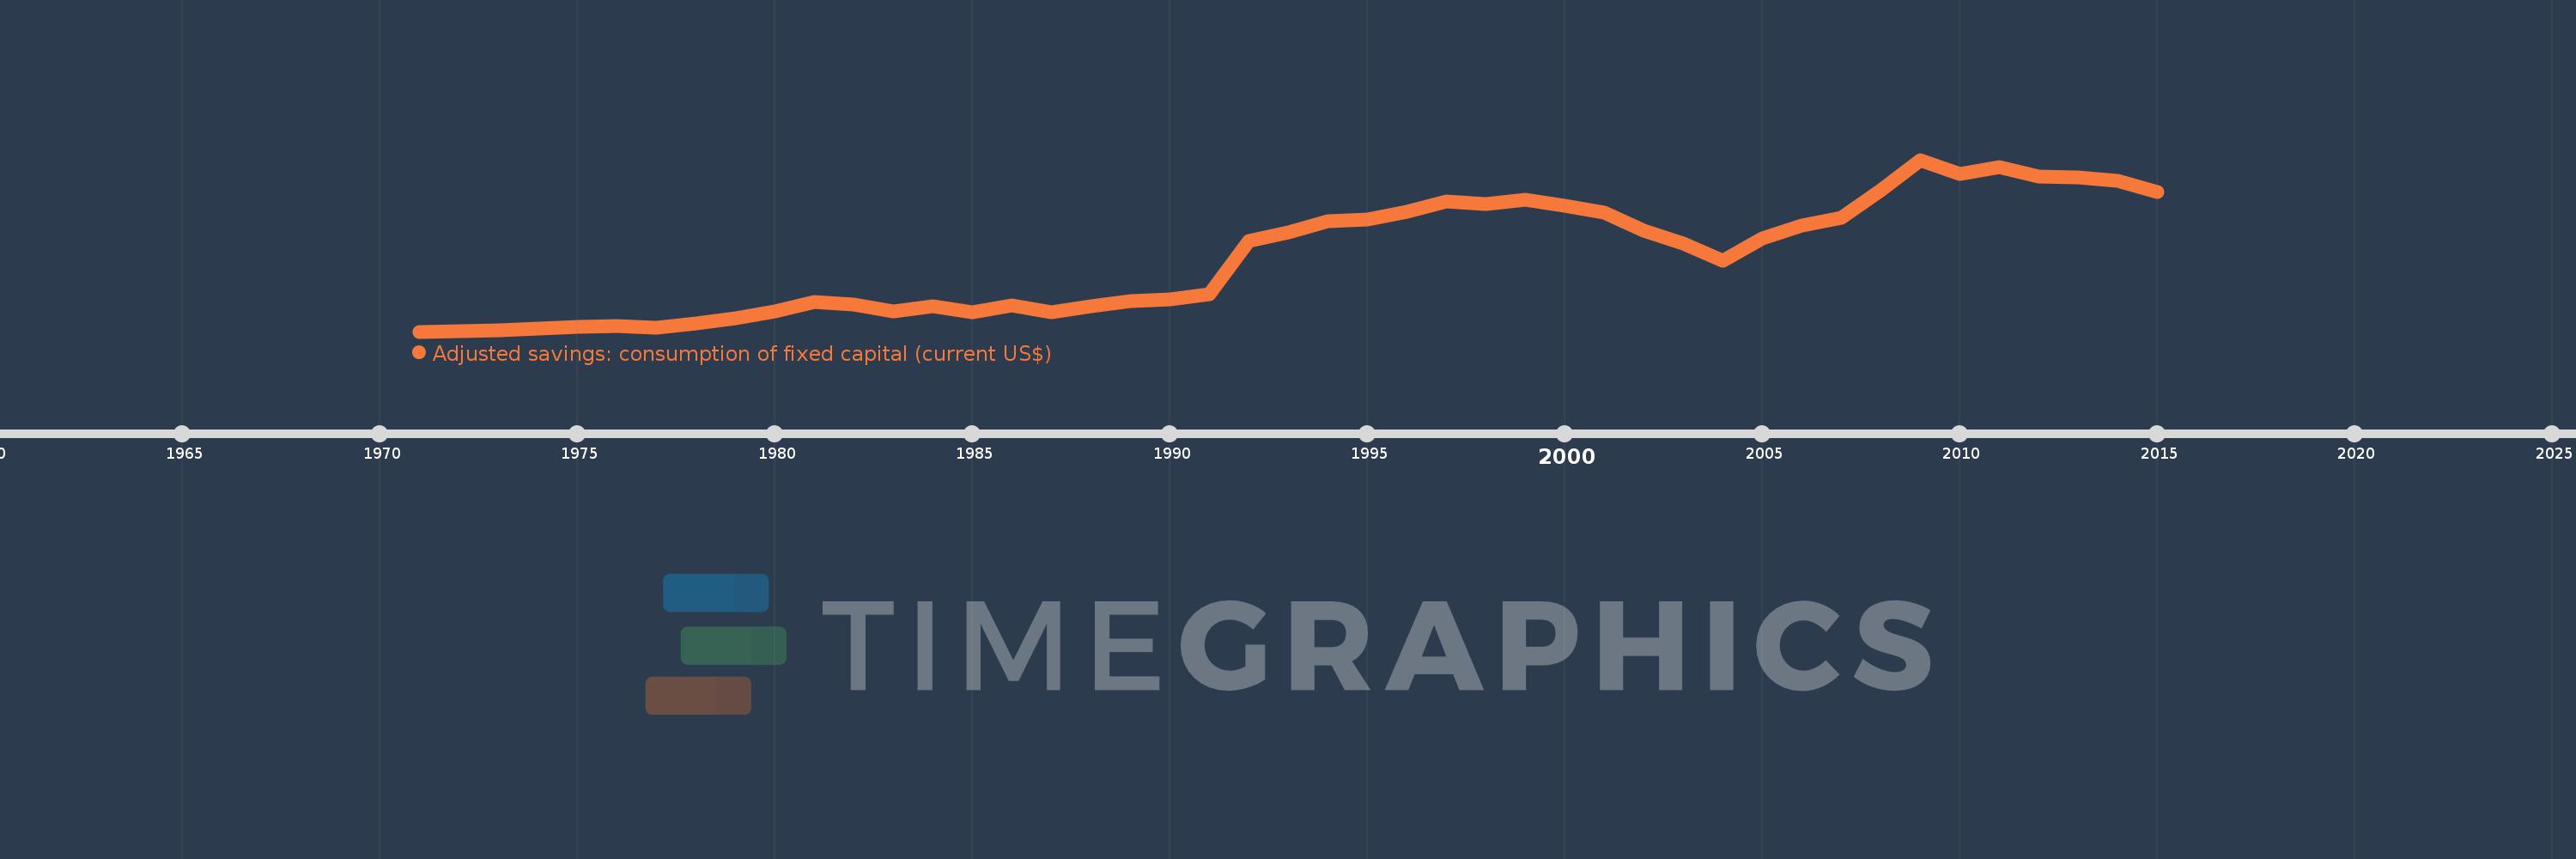
Adjusted savings: consumption of fixed capital (current US$)
2015,2014,2013,2012,2011,2010,2009,2008,2007,2006,2005,2004,2003,2002,2001,2000,1999,1998,1997,1996,1995,1994,1993,1992,1991,1990,1989,1988,1987,1986,1985,1984,1983,1982,1981,1980,1979,1978,1977,1976,1975,1974,1973,1972,1971
Cette statistique dans les autres pays:
AfghanistanAlbaniaAlgeriaAndorraAngolaAntigua and BarbudaArgentinaArmeniaArubaAustraliaAustriaAzerbaijanBahamas, TheBahrainBangladeshBarbadosBelarusBelgiumBelizeBeninBermudaBhutanBoliviaBosnia and HerzegovinaBotswanaBrazilBrunei DarussalamBulgariaBurkina FasoBurundiCabo VerdeCambodiaCameroonCanadaCayman IslandsCentral African RepublicChadChannel IslandsChileChinaColombiaComorosCongo, Dem. Rep.Congo, Rep.Costa RicaCote d'IvoireCroatiaCubaCyprusCzech RepublicDenmarkDjiboutiDominicaDominican RepublicEcuadorEgypt, Arab Rep.El SalvadorEquatorial GuineaEritreaEstoniaEthiopiaFaroe IslandsFijiFinlandFranceFrench PolynesiaGabonGambia, TheGeorgiaGermanyGhanaGreeceGreenlandGrenadaGuatemalaGuineaGuinea-BissauGuyanaHaitiHondurasHong Kong SAR, ChinaHungaryIcelandIndiaIndonesiaIran, Islamic Rep.IraqIrelandIsle of ManIsraelItalyJamaicaJapanJordanKazakhstanKenyaKiribatiKorea, Rep.KosovoKuwaitKyrgyz RepublicLao PDRLatviaLebanonLesothoLiberiaLibyaLiechtensteinLithuaniaLuxembourgMacao SAR, ChinaMacedonia, FYRMadagascarMalawiMalaysiaMaldivesMaliMaltaMarshall IslandsMauritaniaMauritiusMexicoMicronesia, Fed. Sts.MoldovaMonacoMongoliaMontenegroMoroccoMozambiqueMyanmarNamibiaNepalNetherlandsNew CaledoniaNew ZealandNicaraguaNigerNigeriaNorwayOmanPakistanPalauPanamaPapua New GuineaParaguayPeruPhilippinesPolandPortugalPuerto RicoQatarRomaniaRussian FederationRwandaSamoaSan MarinoSao Tome and PrincipeSaudi ArabiaSenegalSerbiaSeychellesSierra LeoneSingaporeSlovak RepublicSloveniaSolomon IslandsSomaliaSouth AfricaSouth SudanSpainSri LankaSt. Kitts and NevisSt. LuciaSt. Vincent and the GrenadinesSudanSurinameSwazilandSwedenSwitzerlandSyrian Arab RepublicTajikistanTanzaniaThailandTimor-LesteTogoTongaTrinidad and TobagoTunisiaTurkeyTurkmenistanTuvaluUgandaUkraineUnited Arab EmiratesUnited KingdomUnited StatesUruguayUzbekistanVanuatuVenezuela, RBVietnamVirgin Islands (U.S.)West Bank and GazaYemen, Rep.ZambiaZimbabwe La ligne de temps
Cette échelle de temps montre un graphique de 1971 année à 2015 année Gambia, The. Les données jusqu'à 1970 année ne sont pas présentés. Quantité d'observations actuelles selon dates: 45.
Source (désignation):
Les indicateurs du développement mondiale
Source (organisation):
World Bank staff estimates using data from the United Nations Statistics Division's National Accounts Statistics.
Catégories:
Economy & Growth, Environment
Dernière mise à jour
23 avr. 2017
Les indicateurs de changement de valeurs selon les années
Minimum:
4.516 mln.
1 janv. 1971
Maximum:
149.147 mln.
1 janv. 2009
Pour la date d''observation
Valeur
Changement absolu
Le changement par rapport à la valeur précédente
1 janv. 1971
4.516 mln.
+4.516 mln.
0.0%
1 janv. 1972
4.929 mln.
+412.963 milles
9.14%
1 janv. 1973
5.569 mln.
+640.115 milles
12.99%
1 janv. 1974
6.823 mln.
+1.254 mln.
22.52%
1 janv. 1975
8.405 mln.
+1.581 mln.
23.17%
1 janv. 1976
9.271 mln.
+866.366 milles
10.31%
1 janv. 1977
8.004 mln.
-1.266 mln.
-13.66%
1 janv. 1978
11.683 mln.
+3.678 mln.
45.95%
1 janv. 1979
15.379 mln.
+3.696 mln.
31.63%
1 janv. 1980
21.681 mln.
+6.302 mln.
40.98%
1 janv. 1981
29.63 mln.
+7.949 mln.
36.66%
1 janv. 1982
27.006 mln.
-2.624 mln.
-8.86%
1 janv. 1983
21.648 mln.
-5.358 mln.
-19.84%
1 janv. 1984
26.037 mln.
+4.389 mln.
20.28%
1 janv. 1985
20.569 mln.
-5.468 mln.
-21.0%
1 janv. 1986
26.292 mln.
+5.722 mln.
27.82%
1 janv. 1987
20.525 mln.
-5.767 mln.
-21.93%
1 janv. 1988
26.045 mln.
+5.52 mln.
26.89%
1 janv. 1989
29.954 mln.
+3.909 mln.
15.01%
1 janv. 1990
31.495 mln.
+1.541 mln.
5.15%
1 janv. 1991
35.96 mln.
+4.465 mln.
14.18%
1 janv. 1992
80.812 mln.
+44.853 mln.
124.73%
1 janv. 1993
87.994 mln.
+7.181 mln.
8.89%
1 janv. 1994
97.118 mln.
+9.124 mln.
10.37%
1 janv. 1995
99.139 mln.
+2.021 mln.
2.08%
1 janv. 1996
105.449 mln.
+6.31 mln.
6.36%
1 janv. 1997
114.094 mln.
+8.645 mln.
8.2%
1 janv. 1998
111.828 mln.
-2.266 mln.
-1.99%
1 janv. 1999
115.69 mln.
+3.862 mln.
3.45%
1 janv. 2000
110.283 mln.
-5.407 mln.
-4.67%
1 janv. 2001
104.648 mln.
-5.635 mln.
-5.11%
1 janv. 2002
89.316 mln.
-15.332 mln.
-14.65%
1 janv. 2003
78.978 mln.
-10.337 mln.
-11.57%
1 janv. 2004
64.323 mln.
-14.655 mln.
-18.56%
1 janv. 2005
83.082 mln.
+18.758 mln.
29.16%
1 janv. 2006
93.665 mln.
+10.583 mln.
12.74%
1 janv. 2007
100.172 mln.
+6.507 mln.
6.95%
1 janv. 2008
123.215 mln.
+23.043 mln.
23.0%
1 janv. 2009
149.147 mln.
+25.932 mln.
21.05%
1 janv. 2010
137.221 mln.
-11.927 mln.
-8.0%
1 janv. 2011
142.742 mln.
+5.521 mln.
4.02%
1 janv. 2012
134.738 mln.
-8.003 mln.
-5.61%
1 janv. 2013
134.326 mln.
-412.792 milles
-0.31%
1 janv. 2014
131.396 mln.
-2.929 mln.
-2.18%
1 janv. 2015
122.169 mln.
-9.227 mln.
-7.02%
Classement des pays selon les statistiques actuelles par années


Commentaires: