29
/fr/
fr
AIzaSyAYiBZKx7MnpbEhh9jyipgxe19OcubqV5w
April 1, 2024
227122
Qatar
QAT
true
2
1
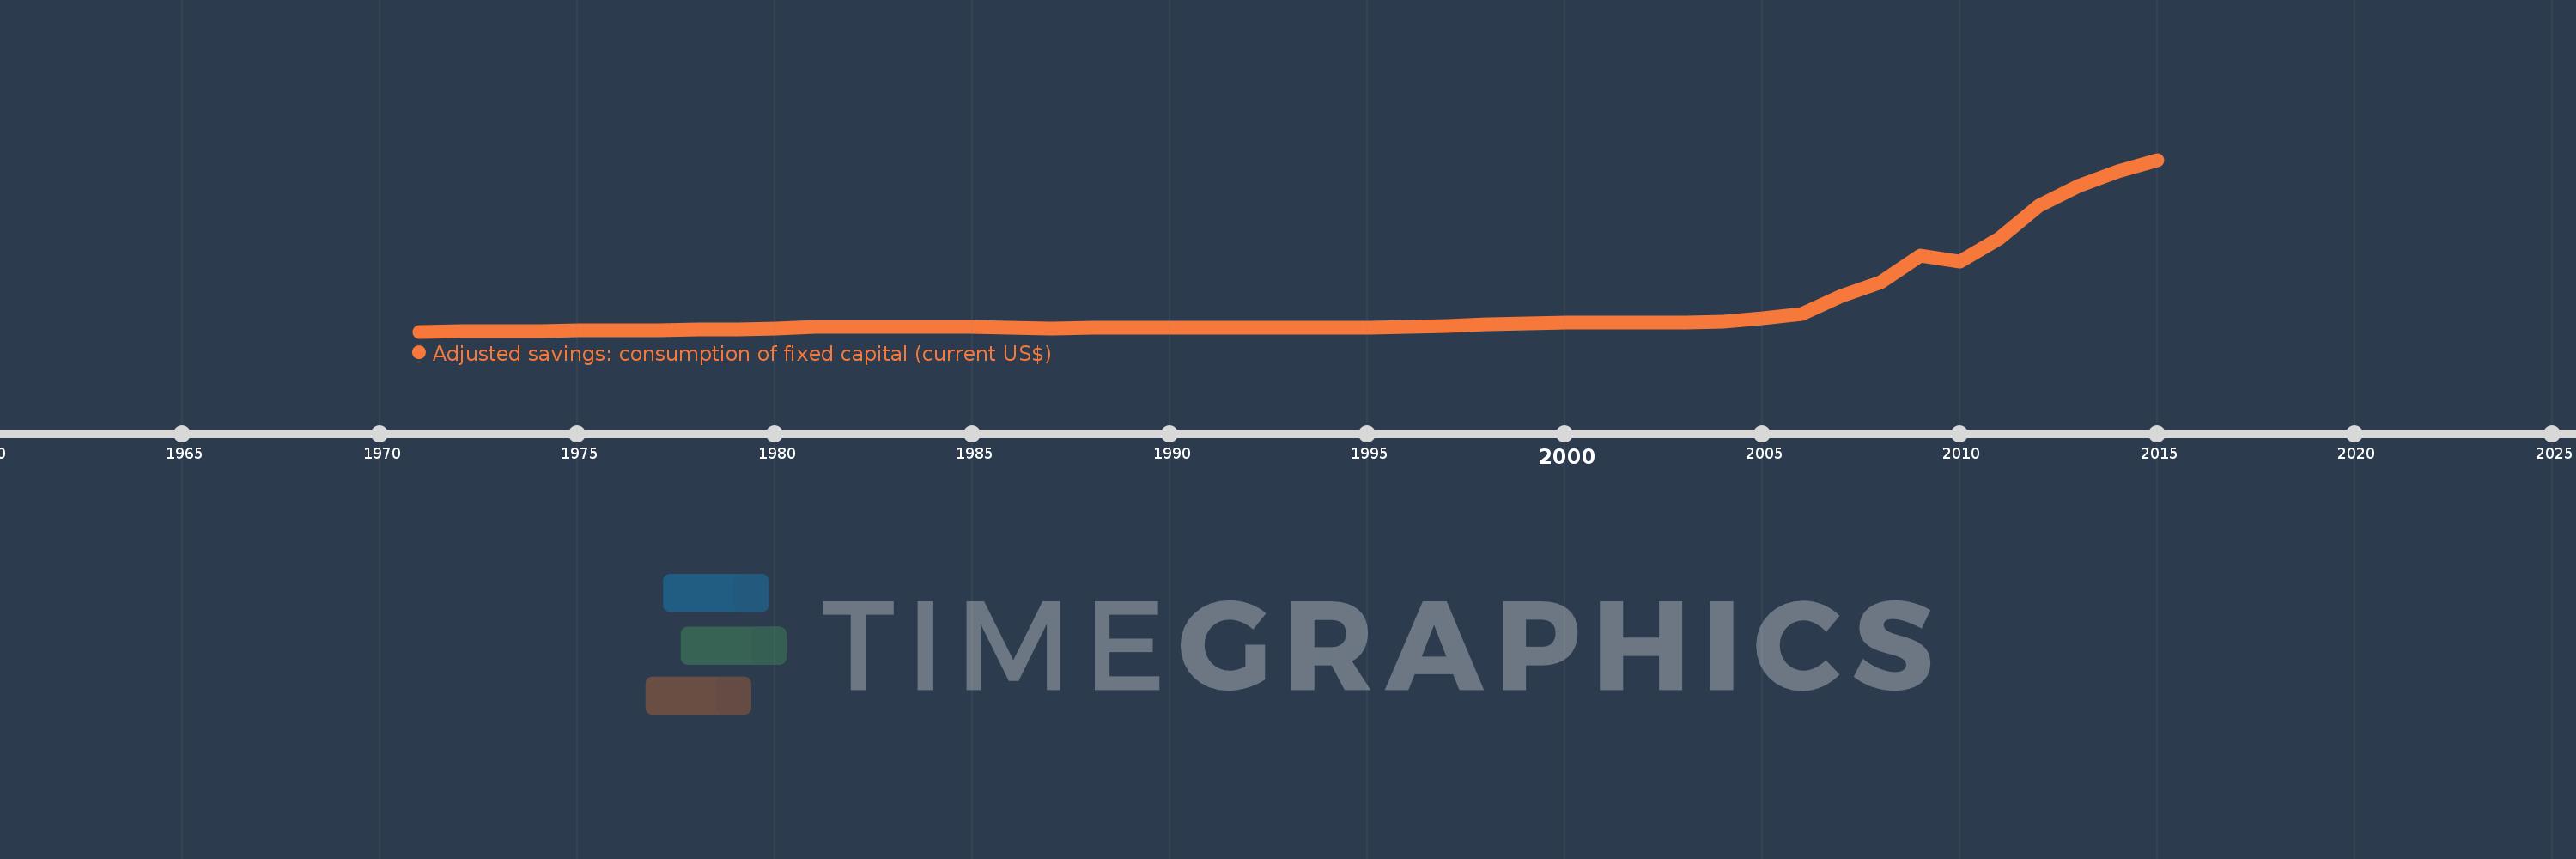
Adjusted savings: consumption of fixed capital (current US$)
2015,2014,2013,2012,2011,2010,2009,2008,2007,2006,2005,2004,2003,2002,2001,2000,1999,1998,1997,1996,1995,1994,1993,1992,1991,1990,1989,1988,1987,1986,1985,1984,1983,1982,1981,1980,1979,1978,1977,1976,1975,1974,1973,1972,1971
Cette statistique dans les autres pays:
AfghanistanAlbaniaAlgeriaAndorraAngolaAntigua and BarbudaArgentinaArmeniaArubaAustraliaAustriaAzerbaijanBahamas, TheBahrainBangladeshBarbadosBelarusBelgiumBelizeBeninBermudaBhutanBoliviaBosnia and HerzegovinaBotswanaBrazilBrunei DarussalamBulgariaBurkina FasoBurundiCabo VerdeCambodiaCameroonCanadaCayman IslandsCentral African RepublicChadChannel IslandsChileChinaColombiaComorosCongo, Dem. Rep.Congo, Rep.Costa RicaCote d'IvoireCroatiaCubaCyprusCzech RepublicDenmarkDjiboutiDominicaDominican RepublicEcuadorEgypt, Arab Rep.El SalvadorEquatorial GuineaEritreaEstoniaEthiopiaFaroe IslandsFijiFinlandFranceFrench PolynesiaGabonGambia, TheGeorgiaGermanyGhanaGreeceGreenlandGrenadaGuatemalaGuineaGuinea-BissauGuyanaHaitiHondurasHong Kong SAR, ChinaHungaryIcelandIndiaIndonesiaIran, Islamic Rep.IraqIrelandIsle of ManIsraelItalyJamaicaJapanJordanKazakhstanKenyaKiribatiKorea, Rep.KosovoKuwaitKyrgyz RepublicLao PDRLatviaLebanonLesothoLiberiaLibyaLiechtensteinLithuaniaLuxembourgMacao SAR, ChinaMacedonia, FYRMadagascarMalawiMalaysiaMaldivesMaliMaltaMarshall IslandsMauritaniaMauritiusMexicoMicronesia, Fed. Sts.MoldovaMonacoMongoliaMontenegroMoroccoMozambiqueMyanmarNamibiaNepalNetherlandsNew CaledoniaNew ZealandNicaraguaNigerNigeriaNorwayOmanPakistanPalauPanamaPapua New GuineaParaguayPeruPhilippinesPolandPortugalPuerto RicoQatarRomaniaRussian FederationRwandaSamoaSan MarinoSao Tome and PrincipeSaudi ArabiaSenegalSerbiaSeychellesSierra LeoneSingaporeSlovak RepublicSloveniaSolomon IslandsSomaliaSouth AfricaSouth SudanSpainSri LankaSt. Kitts and NevisSt. LuciaSt. Vincent and the GrenadinesSudanSurinameSwazilandSwedenSwitzerlandSyrian Arab RepublicTajikistanTanzaniaThailandTimor-LesteTogoTongaTrinidad and TobagoTunisiaTurkeyTurkmenistanTuvaluUgandaUkraineUnited Arab EmiratesUnited KingdomUnited StatesUruguayUzbekistanVanuatuVenezuela, RBVietnamVirgin Islands (U.S.)West Bank and GazaYemen, Rep.ZambiaZimbabwe La ligne de temps
Cette échelle de temps montre un graphique de 1971 année à 2015 année Qatar. Les données jusqu'à 1970 année ne sont pas présentés. Quantité d'observations actuelles selon dates: 45.
Source (désignation):
Les indicateurs du développement mondiale
Source (organisation):
World Bank staff estimates using data from the United Nations Statistics Division's National Accounts Statistics.
Catégories:
Economy & Growth, Environment
Dernière mise à jour
23 avr. 2017
Les indicateurs de changement de valeurs selon les années
Minimum:
31.944 mln.
1 janv. 1971
Maximum:
37.689 mds
1 janv. 2015
Pour la date d''observation
Valeur
Changement absolu
Le changement par rapport à la valeur précédente
1 janv. 1971
31.944 mln.
+31.944 mln.
0.0%
1 janv. 1972
41.541 mln.
+9.597 mln.
30.04%
1 janv. 1973
52.714 mln.
+11.173 mln.
26.9%
1 janv. 1974
79.99 mln.
+27.276 mln.
51.74%
1 janv. 1975
243.058 mln.
+163.068 mln.
203.86%
1 janv. 1976
256.71 mln.
+13.653 mln.
5.62%
1 janv. 1977
345.686 mln.
+88.975 mln.
34.66%
1 janv. 1978
426.866 mln.
+81.181 mln.
23.48%
1 janv. 1979
490.045 mln.
+63.178 mln.
14.8%
1 janv. 1980
705.916 mln.
+215.872 mln.
44.05%
1 janv. 1981
1.035 mds
+329.189 mln.
46.63%
1 janv. 1982
1.153 mds
+118.287 mln.
11.43%
1 janv. 1983
1.086 mds
-67.435 mln.
-5.85%
1 janv. 1984
1.021 mds
-64.941 mln.
-5.98%
1 janv. 1985
1.024 mds
+2.947 mln.
0.29%
1 janv. 1986
944.689 mln.
-79.274 mln.
-7.74%
1 janv. 1987
748.852 mln.
-195.837 mln.
-20.73%
1 janv. 1988
797.672 mln.
+48.82 mln.
6.52%
1 janv. 1989
830.719 mln.
+33.047 mln.
4.14%
1 janv. 1990
850.717 mln.
+19.998 mln.
2.41%
1 janv. 1991
943.295 mln.
+92.578 mln.
10.88%
1 janv. 1992
914.395 mln.
-28.9 mln.
-3.06%
1 janv. 1993
951.977 mln.
+37.582 mln.
4.11%
1 janv. 1994
936.448 mln.
-15.529 mln.
-1.63%
1 janv. 1995
954.037 mln.
+17.589 mln.
1.88%
1 janv. 1996
1.021 mds
+66.937 mln.
7.02%
1 janv. 1997
1.169 mds
+147.982 mln.
14.49%
1 janv. 1998
1.718 mds
+549.451 mln.
47.0%
1 janv. 1999
1.881 mds
+162.912 mln.
9.48%
1 janv. 2000
2.013 mds
+132.143 mln.
7.02%
1 janv. 2001
2.008 mds
-5.22 mln.
-0.26%
1 janv. 2002
2.049 mds
+40.934 mln.
2.04%
1 janv. 2003
1.971 mds
-78.297 mln.
-3.82%
1 janv. 2004
2.125 mds
+153.797 mln.
7.8%
1 janv. 2005
2.949 mds
+824.5 mln.
38.81%
1 janv. 2006
3.862 mds
+913.187 mln.
30.96%
1 janv. 2007
7.871 mds
+4.009 mds
103.78%
1 janv. 2008
10.802 mds
+2.931 mds
37.24%
1 janv. 2009
16.741 mds
+5.939 mds
54.98%
1 janv. 2010
15.417 mds
-1.324 mds
-7.91%
1 janv. 2011
20.431 mds
+5.013 mds
32.52%
1 janv. 2012
27.56 mds
+7.13 mds
34.9%
1 janv. 2013
31.968 mds
+4.408 mds
15.99%
1 janv. 2014
35.065 mds
+3.097 mds
9.69%
1 janv. 2015
37.689 mds
+2.624 mds
7.48%
Classement des pays selon les statistiques actuelles par années


Commentaires: