29
/fr/
fr
AIzaSyAYiBZKx7MnpbEhh9jyipgxe19OcubqV5w
April 1, 2024
84951
Bermuda
BMU
true
2
1
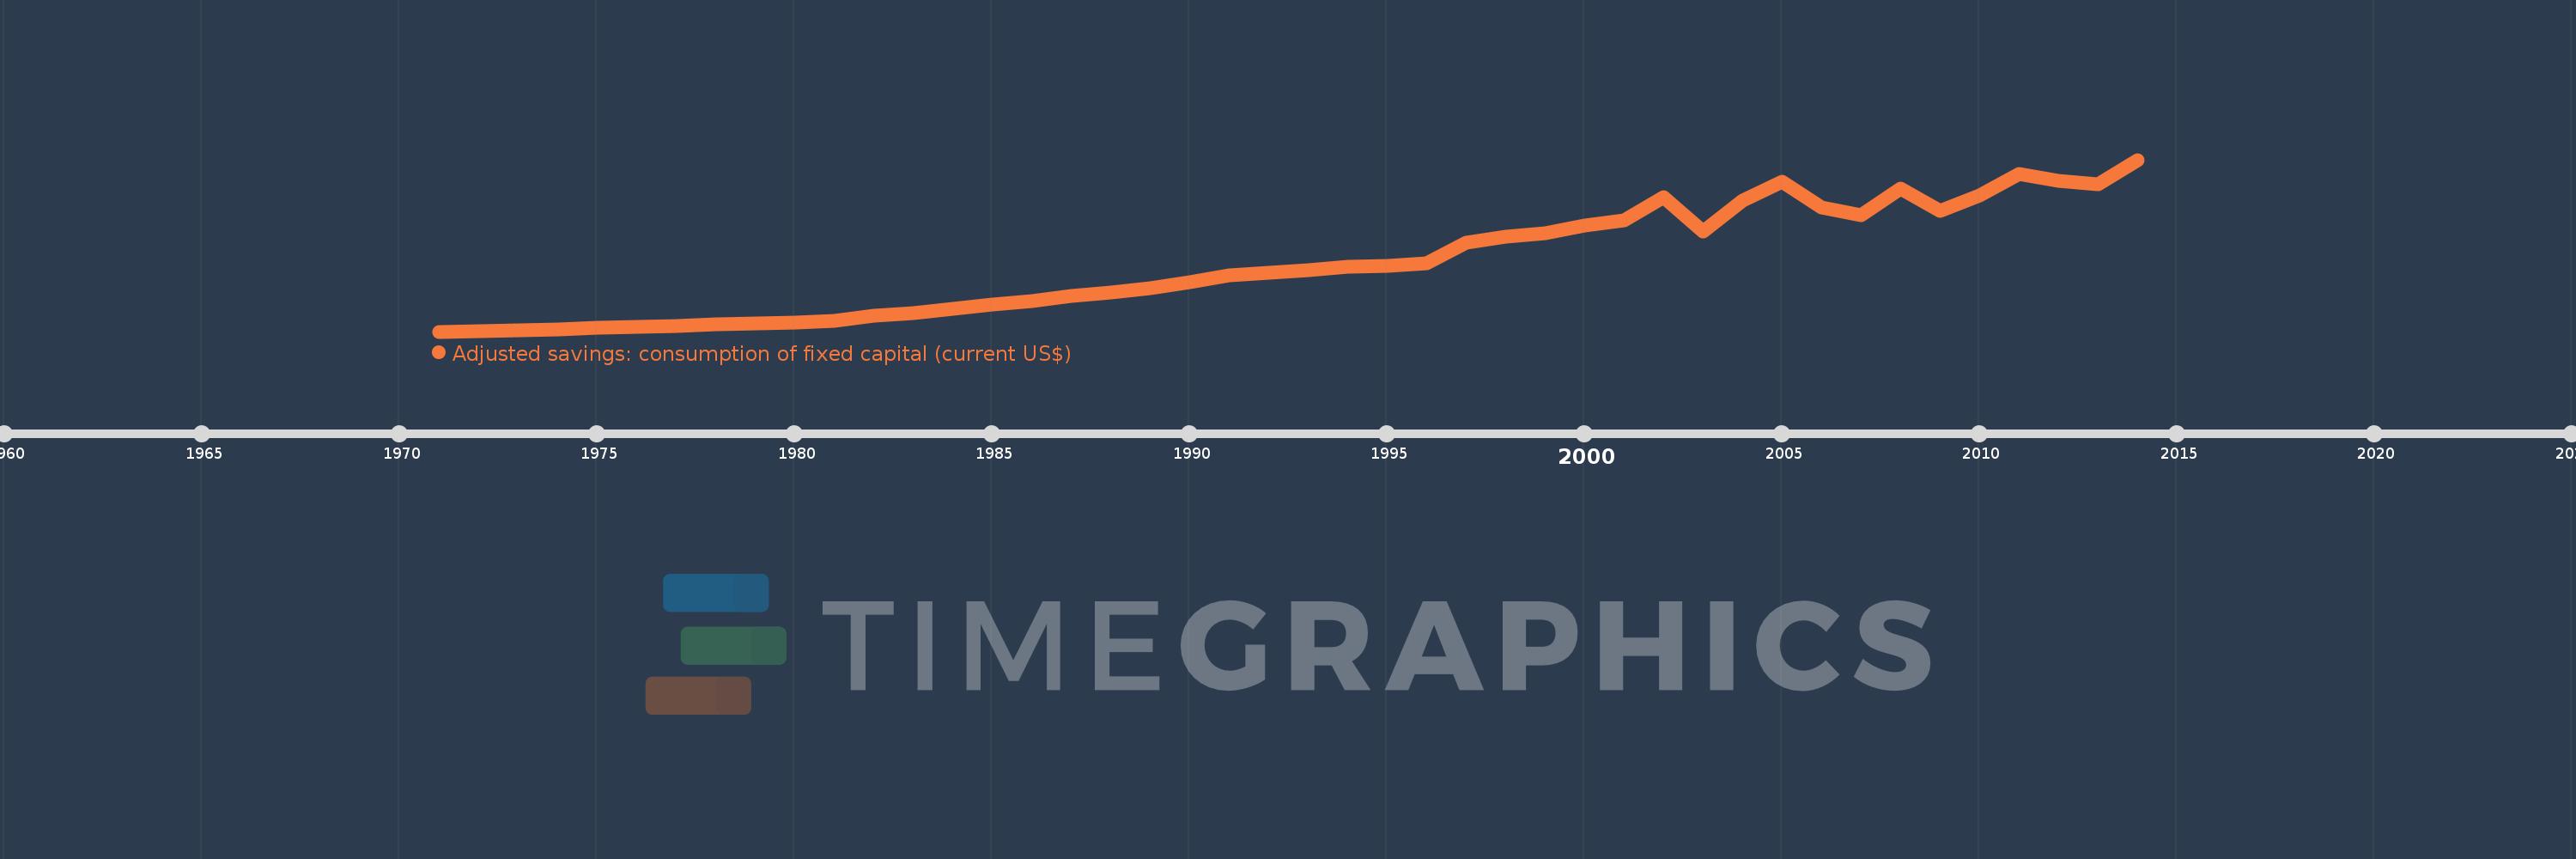
Adjusted savings: consumption of fixed capital (current US$)
2014,2013,2012,2011,2010,2009,2008,2007,2006,2005,2004,2003,2002,2001,2000,1999,1998,1997,1996,1995,1994,1993,1992,1991,1990,1989,1988,1987,1986,1985,1984,1983,1982,1981,1980,1979,1978,1977,1976,1975,1974,1973,1972,1971
Cette statistique dans les autres pays:
AfghanistanAlbaniaAlgeriaAndorraAngolaAntigua and BarbudaArgentinaArmeniaArubaAustraliaAustriaAzerbaijanBahamas, TheBahrainBangladeshBarbadosBelarusBelgiumBelizeBeninBermudaBhutanBoliviaBosnia and HerzegovinaBotswanaBrazilBrunei DarussalamBulgariaBurkina FasoBurundiCabo VerdeCambodiaCameroonCanadaCayman IslandsCentral African RepublicChadChannel IslandsChileChinaColombiaComorosCongo, Dem. Rep.Congo, Rep.Costa RicaCote d'IvoireCroatiaCubaCyprusCzech RepublicDenmarkDjiboutiDominicaDominican RepublicEcuadorEgypt, Arab Rep.El SalvadorEquatorial GuineaEritreaEstoniaEthiopiaFaroe IslandsFijiFinlandFranceFrench PolynesiaGabonGambia, TheGeorgiaGermanyGhanaGreeceGreenlandGrenadaGuatemalaGuineaGuinea-BissauGuyanaHaitiHondurasHong Kong SAR, ChinaHungaryIcelandIndiaIndonesiaIran, Islamic Rep.IraqIrelandIsle of ManIsraelItalyJamaicaJapanJordanKazakhstanKenyaKiribatiKorea, Rep.KosovoKuwaitKyrgyz RepublicLao PDRLatviaLebanonLesothoLiberiaLibyaLiechtensteinLithuaniaLuxembourgMacao SAR, ChinaMacedonia, FYRMadagascarMalawiMalaysiaMaldivesMaliMaltaMarshall IslandsMauritaniaMauritiusMexicoMicronesia, Fed. Sts.MoldovaMonacoMongoliaMontenegroMoroccoMozambiqueMyanmarNamibiaNepalNetherlandsNew CaledoniaNew ZealandNicaraguaNigerNigeriaNorwayOmanPakistanPalauPanamaPapua New GuineaParaguayPeruPhilippinesPolandPortugalPuerto RicoQatarRomaniaRussian FederationRwandaSamoaSan MarinoSao Tome and PrincipeSaudi ArabiaSenegalSerbiaSeychellesSierra LeoneSingaporeSlovak RepublicSloveniaSolomon IslandsSomaliaSouth AfricaSouth SudanSpainSri LankaSt. Kitts and NevisSt. LuciaSt. Vincent and the GrenadinesSudanSurinameSwazilandSwedenSwitzerlandSyrian Arab RepublicTajikistanTanzaniaThailandTimor-LesteTogoTongaTrinidad and TobagoTunisiaTurkeyTurkmenistanTuvaluUgandaUkraineUnited Arab EmiratesUnited KingdomUnited StatesUruguayUzbekistanVanuatuVenezuela, RBVietnamVirgin Islands (U.S.)West Bank and GazaYemen, Rep.ZambiaZimbabwe La ligne de temps
Cette échelle de temps montre un graphique de 1971 année à 2014 année Bermuda. Les données jusqu'à 1970 année ne sont pas présentés. Quantité d'observations actuelles selon dates: 44.
Source (désignation):
Les indicateurs du développement mondiale
Source (organisation):
World Bank staff estimates using data from the United Nations Statistics Division's National Accounts Statistics.
Catégories:
Economy & Growth, Environment
Dernière mise à jour
23 avr. 2017
Les indicateurs de changement de valeurs selon les années
Minimum:
10.252 mln.
1 janv. 1971
Maximum:
377.11 mln.
1 janv. 2014
Pour la date d''observation
Valeur
Changement absolu
Le changement par rapport à la valeur précédente
1 janv. 1971
10.252 mln.
+10.252 mln.
0.0%
1 janv. 1972
11.698 mln.
+1.446 mln.
14.11%
1 janv. 1973
13.453 mln.
+1.755 mln.
15.0%
1 janv. 1974
15.751 mln.
+2.298 mln.
17.08%
1 janv. 1975
18.712 mln.
+2.961 mln.
18.8%
1 janv. 1976
20.535 mln.
+1.823 mln.
9.74%
1 janv. 1977
22.088 mln.
+1.553 mln.
7.57%
1 janv. 1978
25.318 mln.
+3.23 mln.
14.62%
1 janv. 1979
27.054 mln.
+1.736 mln.
6.86%
1 janv. 1980
28.717 mln.
+1.663 mln.
6.15%
1 janv. 1981
33.919 mln.
+5.203 mln.
18.12%
1 janv. 1982
44.716 mln.
+10.797 mln.
31.83%
1 janv. 1983
48.957 mln.
+4.24 mln.
9.48%
1 janv. 1984
58.205 mln.
+9.248 mln.
18.89%
1 janv. 1985
68.911 mln.
+10.706 mln.
18.39%
1 janv. 1986
75.636 mln.
+6.726 mln.
9.76%
1 janv. 1987
86.385 mln.
+10.749 mln.
14.21%
1 janv. 1988
94.262 mln.
+7.878 mln.
9.12%
1 janv. 1989
103.731 mln.
+9.469 mln.
10.04%
1 janv. 1990
116.412 mln.
+12.681 mln.
12.22%
1 janv. 1991
130.815 mln.
+14.403 mln.
12.37%
1 janv. 1992
135.355 mln.
+4.54 mln.
3.47%
1 janv. 1993
140.804 mln.
+5.449 mln.
4.03%
1 janv. 1994
148.628 mln.
+7.824 mln.
5.56%
1 janv. 1995
150.651 mln.
+2.023 mln.
1.36%
1 janv. 1996
156.627 mln.
+5.976 mln.
3.97%
1 janv. 1997
200.939 mln.
+44.312 mln.
28.29%
1 janv. 1998
213.458 mln.
+12.519 mln.
6.23%
1 janv. 1999
220.923 mln.
+7.465 mln.
3.5%
1 janv. 2000
236.557 mln.
+15.634 mln.
7.08%
1 janv. 2001
247.391 mln.
+10.834 mln.
4.58%
1 janv. 2002
297.639 mln.
+50.248 mln.
20.31%
1 janv. 2003
224.588 mln.
-73.051 mln.
-24.54%
1 janv. 2004
289.457 mln.
+64.869 mln.
28.88%
1 janv. 2005
329.583 mln.
+40.126 mln.
13.86%
1 janv. 2006
275.692 mln.
-53.891 mln.
-16.35%
1 janv. 2007
258.8 mln.
-16.892 mln.
-6.13%
1 janv. 2008
315.201 mln.
+56.401 mln.
21.79%
1 janv. 2009
267.218 mln.
-47.983 mln.
-15.22%
1 janv. 2010
300.205 mln.
+32.987 mln.
12.34%
1 janv. 2011
346.576 mln.
+46.371 mln.
15.45%
1 janv. 2012
331.325 mln.
-15.251 mln.
-4.4%
1 janv. 2013
325.248 mln.
-6.077 mln.
-1.83%
1 janv. 2014
377.11 mln.
+51.862 mln.
15.95%
Classement des pays selon les statistiques actuelles par années


Commentaires: