29
/fr/
fr
AIzaSyAYiBZKx7MnpbEhh9jyipgxe19OcubqV5w
April 1, 2024
209025
New Zealand
NZL
true
2
1
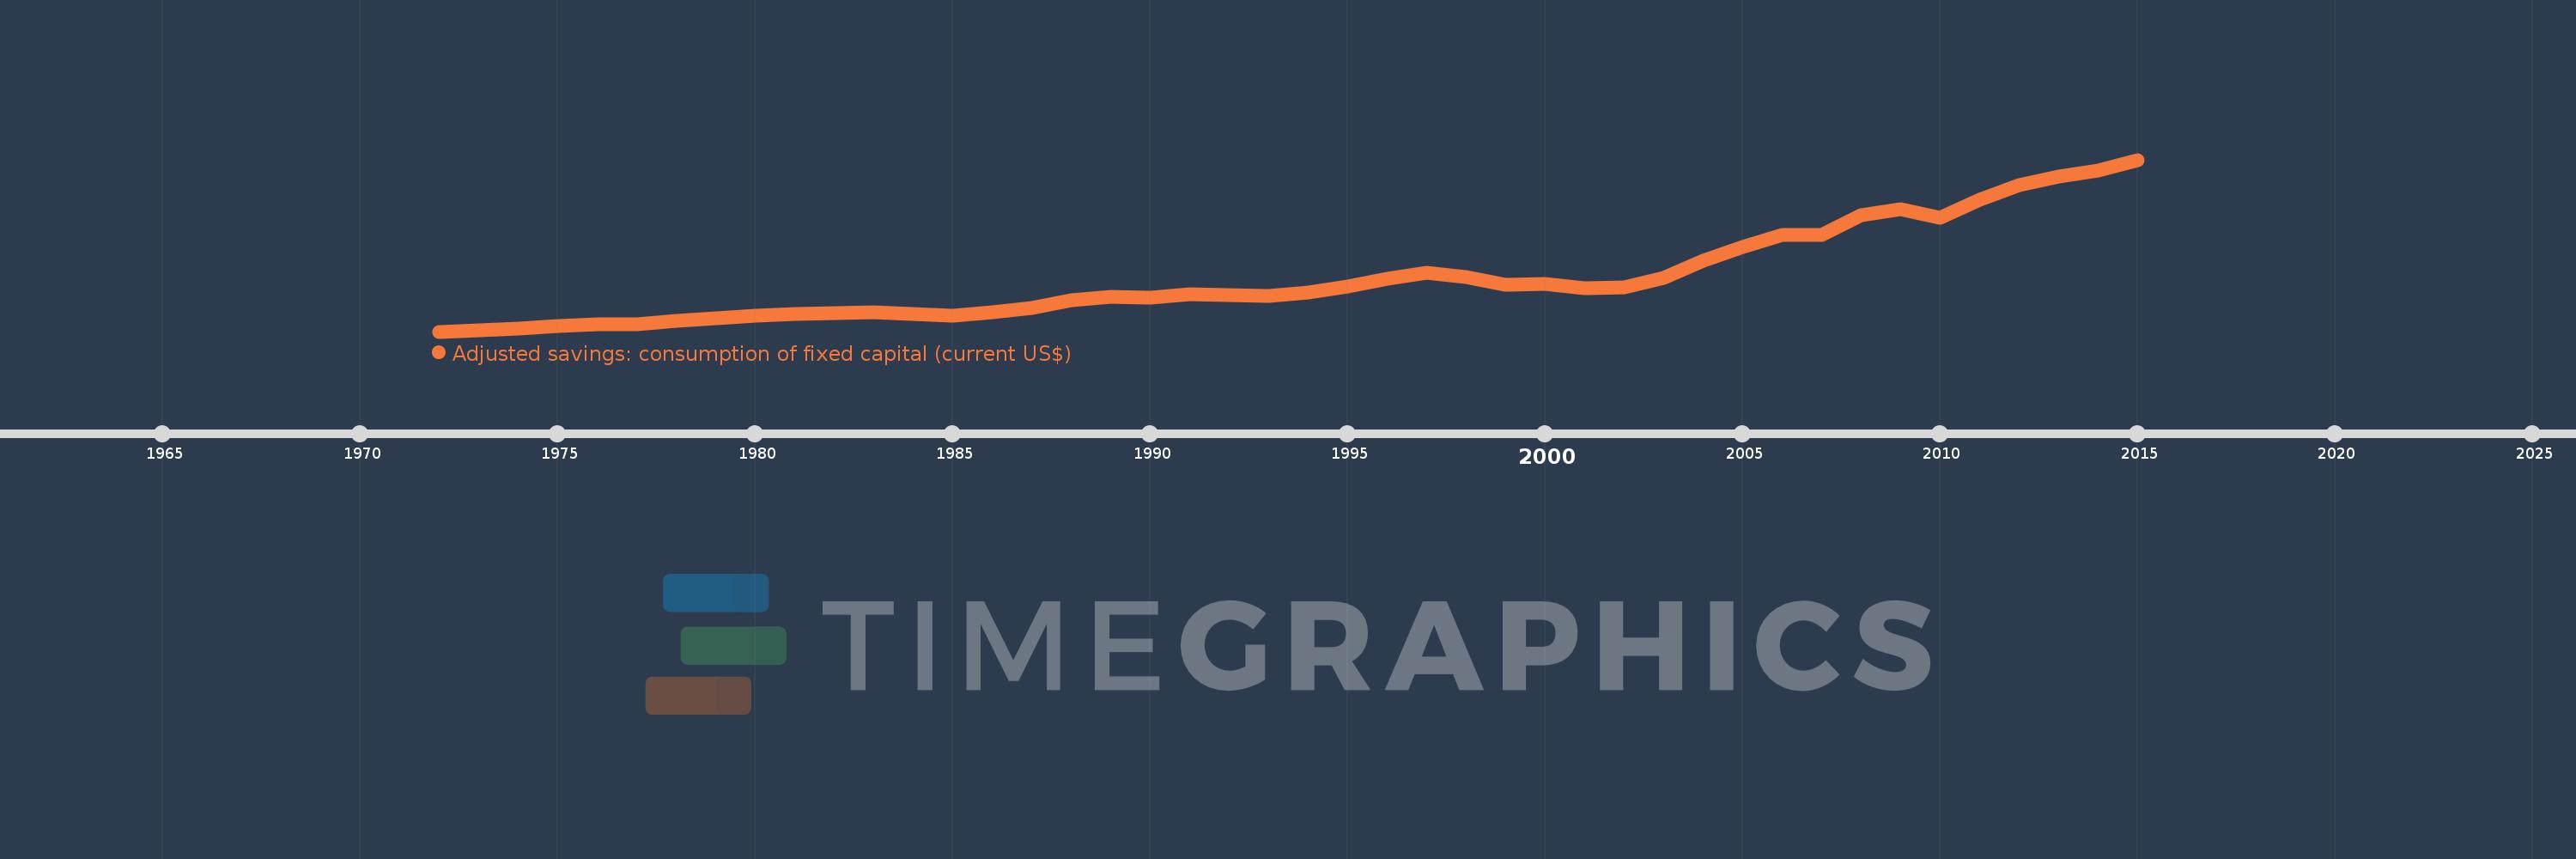
Adjusted savings: consumption of fixed capital (current US$)
2015,2014,2013,2012,2011,2010,2009,2008,2007,2006,2005,2004,2003,2002,2001,2000,1999,1998,1997,1996,1995,1994,1993,1992,1991,1990,1989,1988,1987,1986,1985,1984,1983,1982,1981,1980,1979,1978,1977,1976,1975,1974,1973,1972
Cette statistique dans les autres pays:
AfghanistanAlbaniaAlgeriaAndorraAngolaAntigua and BarbudaArgentinaArmeniaArubaAustraliaAustriaAzerbaijanBahamas, TheBahrainBangladeshBarbadosBelarusBelgiumBelizeBeninBermudaBhutanBoliviaBosnia and HerzegovinaBotswanaBrazilBrunei DarussalamBulgariaBurkina FasoBurundiCabo VerdeCambodiaCameroonCanadaCayman IslandsCentral African RepublicChadChannel IslandsChileChinaColombiaComorosCongo, Dem. Rep.Congo, Rep.Costa RicaCote d'IvoireCroatiaCubaCyprusCzech RepublicDenmarkDjiboutiDominicaDominican RepublicEcuadorEgypt, Arab Rep.El SalvadorEquatorial GuineaEritreaEstoniaEthiopiaFaroe IslandsFijiFinlandFranceFrench PolynesiaGabonGambia, TheGeorgiaGermanyGhanaGreeceGreenlandGrenadaGuatemalaGuineaGuinea-BissauGuyanaHaitiHondurasHong Kong SAR, ChinaHungaryIcelandIndiaIndonesiaIran, Islamic Rep.IraqIrelandIsle of ManIsraelItalyJamaicaJapanJordanKazakhstanKenyaKiribatiKorea, Rep.KosovoKuwaitKyrgyz RepublicLao PDRLatviaLebanonLesothoLiberiaLibyaLiechtensteinLithuaniaLuxembourgMacao SAR, ChinaMacedonia, FYRMadagascarMalawiMalaysiaMaldivesMaliMaltaMarshall IslandsMauritaniaMauritiusMexicoMicronesia, Fed. Sts.MoldovaMonacoMongoliaMontenegroMoroccoMozambiqueMyanmarNamibiaNepalNetherlandsNew CaledoniaNew ZealandNicaraguaNigerNigeriaNorwayOmanPakistanPalauPanamaPapua New GuineaParaguayPeruPhilippinesPolandPortugalPuerto RicoQatarRomaniaRussian FederationRwandaSamoaSan MarinoSao Tome and PrincipeSaudi ArabiaSenegalSerbiaSeychellesSierra LeoneSingaporeSlovak RepublicSloveniaSolomon IslandsSomaliaSouth AfricaSouth SudanSpainSri LankaSt. Kitts and NevisSt. LuciaSt. Vincent and the GrenadinesSudanSurinameSwazilandSwedenSwitzerlandSyrian Arab RepublicTajikistanTanzaniaThailandTimor-LesteTogoTongaTrinidad and TobagoTunisiaTurkeyTurkmenistanTuvaluUgandaUkraineUnited Arab EmiratesUnited KingdomUnited StatesUruguayUzbekistanVanuatuVenezuela, RBVietnamVirgin Islands (U.S.)West Bank and GazaYemen, Rep.ZambiaZimbabwe La ligne de temps
Cette échelle de temps montre un graphique de 1972 année à 2015 année New Zealand. Les données jusqu'à 1971 année ne sont pas présentés. Quantité d'observations actuelles selon dates: 44.
Source (désignation):
Les indicateurs du développement mondiale
Source (organisation):
World Bank staff estimates using data from the United Nations Statistics Division's National Accounts Statistics.
Catégories:
Economy & Growth, Environment
Dernière mise à jour
23 avr. 2017
Les indicateurs de changement de valeurs selon les années
Minimum:
896.707 mln.
1 janv. 1972
Maximum:
27.781 mds
1 janv. 2015
Pour la date d''observation
Valeur
Changement absolu
Le changement par rapport à la valeur précédente
1 janv. 1972
896.707 mln.
+896.707 mln.
0.0%
1 janv. 1973
1.08 mds
+183.767 mln.
20.49%
1 janv. 1974
1.43 mds
+349.898 mln.
32.38%
1 janv. 1975
1.762 mds
+331.873 mln.
23.2%
1 janv. 1976
2.01 mds
+248.16 mln.
14.08%
1 janv. 1977
2.099 mds
+88.225 mln.
4.39%
1 janv. 1978
2.555 mds
+455.928 mln.
21.73%
1 janv. 1979
3.042 mds
+487.876 mln.
19.1%
1 janv. 1980
3.419 mds
+376.379 mln.
12.37%
1 janv. 1981
3.703 mds
+284.141 mln.
8.31%
1 janv. 1982
3.807 mds
+103.558 mln.
2.8%
1 janv. 1983
3.867 mds
+60.205 mln.
1.58%
1 janv. 1984
3.716 mds
-150.89 mln.
-3.9%
1 janv. 1985
3.327 mds
-388.541 mln.
-10.46%
1 janv. 1986
3.894 mds
+566.322 mln.
17.02%
1 janv. 1987
4.651 mds
+757.881 mln.
19.46%
1 janv. 1988
5.855 mds
+1.203 mds
25.86%
1 janv. 1989
6.366 mds
+511.925 mln.
8.74%
1 janv. 1990
6.24 mds
-126.956 mln.
-1.99%
1 janv. 1991
6.75 mds
+509.978 mln.
8.17%
1 janv. 1992
6.636 mds
-113.199 mln.
-1.68%
1 janv. 1993
6.513 mds
-123.161 mln.
-1.86%
1 janv. 1994
6.99 mds
+476.533 mln.
7.32%
1 janv. 1995
8.011 mds
+1.021 mds
14.61%
1 janv. 1996
9.176 mds
+1.165 mds
14.54%
1 janv. 1997
10.071 mds
+894.986 mln.
9.75%
1 janv. 1998
9.43 mds
-641.208 mln.
-6.37%
1 janv. 1999
8.249 mds
-1.18 mds
-12.52%
1 janv. 2000
8.371 mds
+121.374 mln.
1.47%
1 janv. 2001
7.717 mds
-653.725 mln.
-7.81%
1 janv. 2002
7.754 mds
+37.457 mln.
0.49%
1 janv. 2003
9.325 mds
+1.571 mds
20.26%
1 janv. 2004
12.026 mds
+2.7 mds
28.96%
1 janv. 2005
14.179 mds
+2.153 mds
17.9%
1 janv. 2006
15.955 mds
+1.776 mds
12.53%
1 janv. 2007
16.057 mds
+101.548 mln.
0.64%
1 janv. 2008
19.164 mds
+3.107 mds
19.35%
1 janv. 2009
20.057 mds
+893.368 mln.
4.66%
1 janv. 2010
18.67 mds
-1.387 mds
-6.92%
1 janv. 2011
21.525 mds
+2.856 mds
15.3%
1 janv. 2012
23.85 mds
+2.324 mds
10.8%
1 janv. 2013
25.113 mds
+1.264 mds
5.3%
1 janv. 2014
26.109 mds
+995.987 mln.
3.97%
1 janv. 2015
27.781 mds
+1.671 mds
6.4%
Classement des pays selon les statistiques actuelles par années


Commentaires: