29
/fr/
fr
AIzaSyAYiBZKx7MnpbEhh9jyipgxe19OcubqV5w
April 1, 2024
181801
Luxembourg
LUX
true
2
1
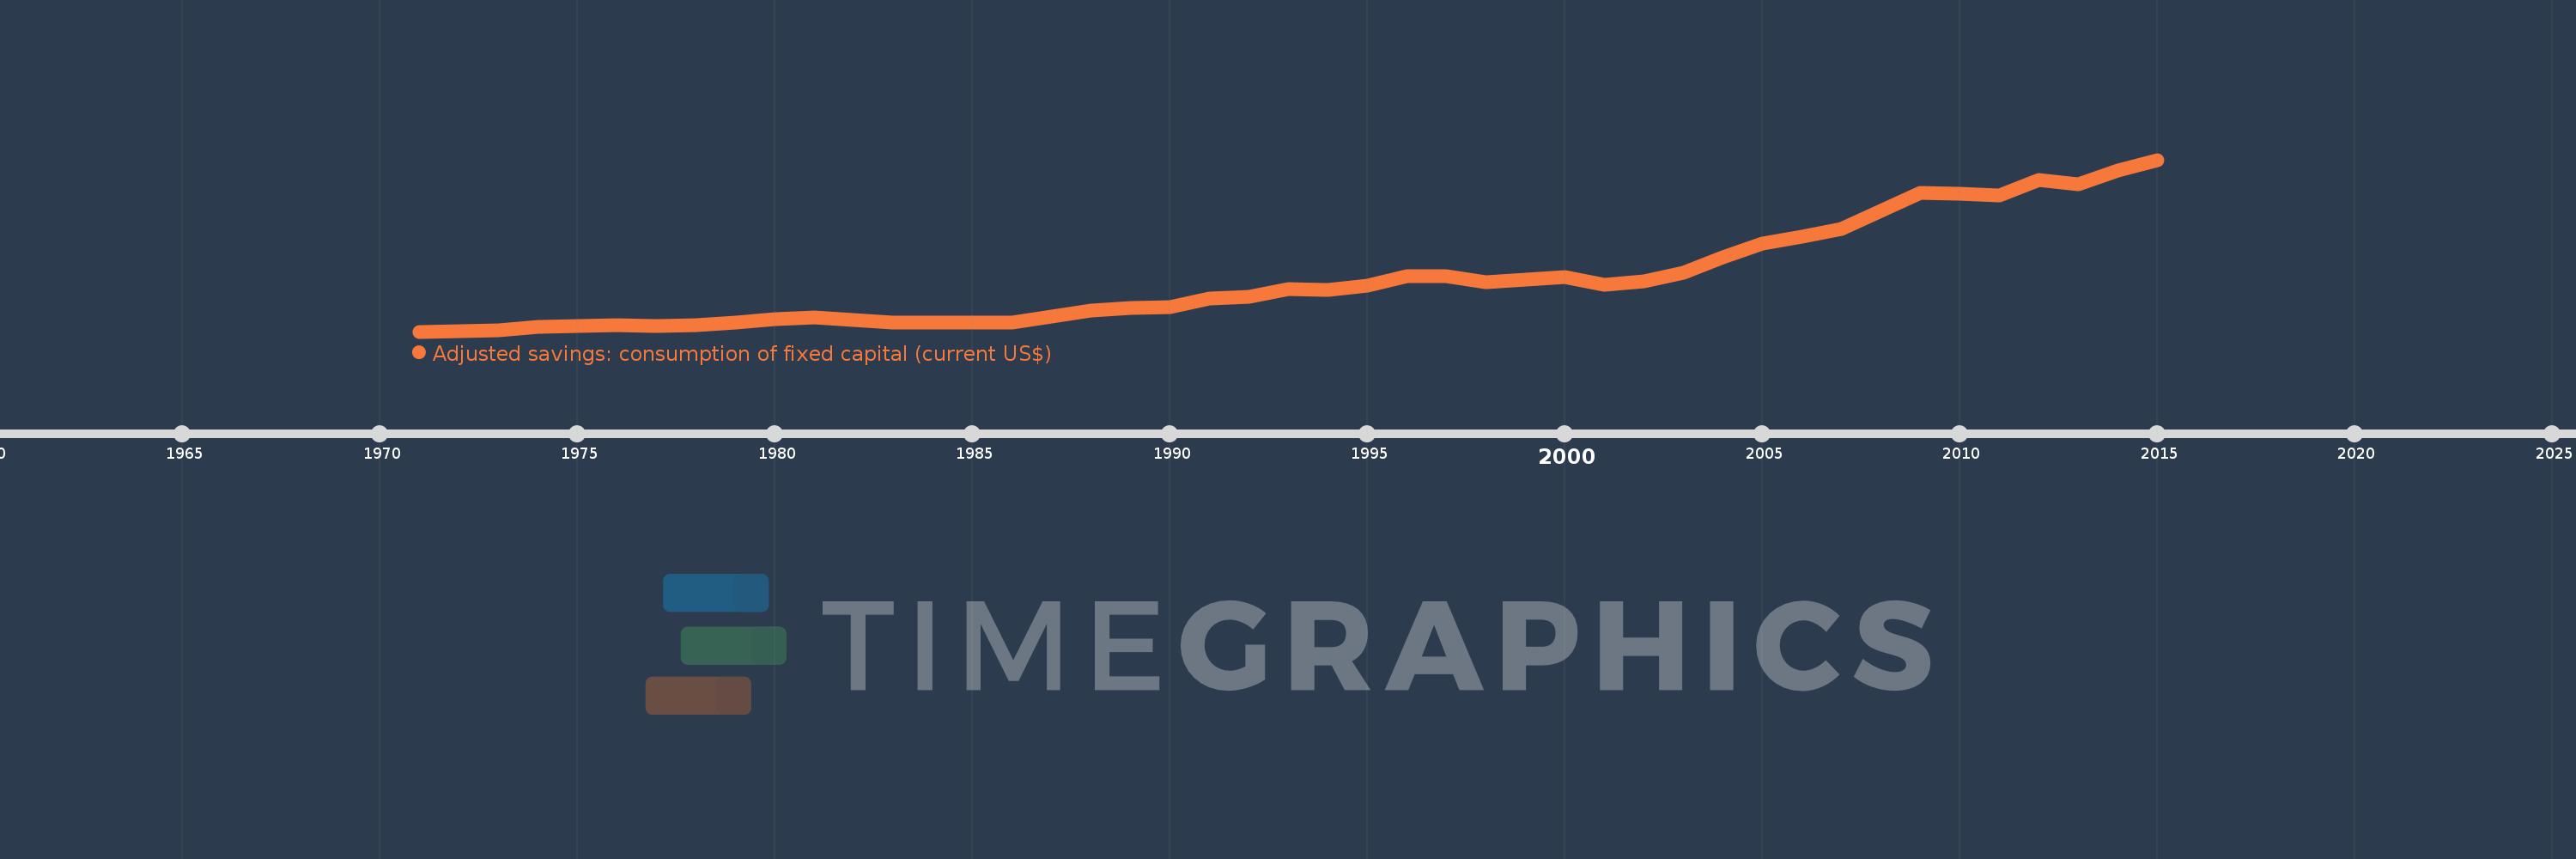
Adjusted savings: consumption of fixed capital (current US$)
2015,2014,2013,2012,2011,2010,2009,2008,2007,2006,2005,2004,2003,2002,2001,2000,1999,1998,1997,1996,1995,1994,1993,1992,1991,1990,1989,1988,1987,1986,1985,1984,1983,1982,1981,1980,1979,1978,1977,1976,1975,1974,1973,1972,1971
Cette statistique dans les autres pays:
AfghanistanAlbaniaAlgeriaAndorraAngolaAntigua and BarbudaArgentinaArmeniaArubaAustraliaAustriaAzerbaijanBahamas, TheBahrainBangladeshBarbadosBelarusBelgiumBelizeBeninBermudaBhutanBoliviaBosnia and HerzegovinaBotswanaBrazilBrunei DarussalamBulgariaBurkina FasoBurundiCabo VerdeCambodiaCameroonCanadaCayman IslandsCentral African RepublicChadChannel IslandsChileChinaColombiaComorosCongo, Dem. Rep.Congo, Rep.Costa RicaCote d'IvoireCroatiaCubaCyprusCzech RepublicDenmarkDjiboutiDominicaDominican RepublicEcuadorEgypt, Arab Rep.El SalvadorEquatorial GuineaEritreaEstoniaEthiopiaFaroe IslandsFijiFinlandFranceFrench PolynesiaGabonGambia, TheGeorgiaGermanyGhanaGreeceGreenlandGrenadaGuatemalaGuineaGuinea-BissauGuyanaHaitiHondurasHong Kong SAR, ChinaHungaryIcelandIndiaIndonesiaIran, Islamic Rep.IraqIrelandIsle of ManIsraelItalyJamaicaJapanJordanKazakhstanKenyaKiribatiKorea, Rep.KosovoKuwaitKyrgyz RepublicLao PDRLatviaLebanonLesothoLiberiaLibyaLiechtensteinLithuaniaLuxembourgMacao SAR, ChinaMacedonia, FYRMadagascarMalawiMalaysiaMaldivesMaliMaltaMarshall IslandsMauritaniaMauritiusMexicoMicronesia, Fed. Sts.MoldovaMonacoMongoliaMontenegroMoroccoMozambiqueMyanmarNamibiaNepalNetherlandsNew CaledoniaNew ZealandNicaraguaNigerNigeriaNorwayOmanPakistanPalauPanamaPapua New GuineaParaguayPeruPhilippinesPolandPortugalPuerto RicoQatarRomaniaRussian FederationRwandaSamoaSan MarinoSao Tome and PrincipeSaudi ArabiaSenegalSerbiaSeychellesSierra LeoneSingaporeSlovak RepublicSloveniaSolomon IslandsSomaliaSouth AfricaSouth SudanSpainSri LankaSt. Kitts and NevisSt. LuciaSt. Vincent and the GrenadinesSudanSurinameSwazilandSwedenSwitzerlandSyrian Arab RepublicTajikistanTanzaniaThailandTimor-LesteTogoTongaTrinidad and TobagoTunisiaTurkeyTurkmenistanTuvaluUgandaUkraineUnited Arab EmiratesUnited KingdomUnited StatesUruguayUzbekistanVanuatuVenezuela, RBVietnamVirgin Islands (U.S.)West Bank and GazaYemen, Rep.ZambiaZimbabwe La ligne de temps
Cette échelle de temps montre un graphique de 1971 année à 2015 année Luxembourg. Les données jusqu'à 1970 année ne sont pas présentés. Quantité d'observations actuelles selon dates: 45.
Source (désignation):
Les indicateurs du développement mondiale
Source (organisation):
World Bank staff estimates using data from the United Nations Statistics Division's National Accounts Statistics.
Catégories:
Economy & Growth, Environment
Dernière mise à jour
23 avr. 2017
Les indicateurs de changement de valeurs selon les années
Minimum:
283.401 mln.
1 janv. 1971
Maximum:
8.544 mds
1 janv. 2015
Pour la date d''observation
Valeur
Changement absolu
Le changement par rapport à la valeur précédente
1 janv. 1971
283.401 mln.
+283.401 mln.
0.0%
1 janv. 1972
316.169 mln.
+32.768 mln.
11.56%
1 janv. 1973
363.341 mln.
+47.172 mln.
14.92%
1 janv. 1974
519.337 mln.
+155.996 mln.
42.93%
1 janv. 1975
562.687 mln.
+43.35 mln.
8.35%
1 janv. 1976
605.9 mln.
+43.213 mln.
7.68%
1 janv. 1977
570.731 mln.
-35.169 mln.
-5.8%
1 janv. 1978
606.134 mln.
+35.403 mln.
6.2%
1 janv. 1979
732.92 mln.
+126.785 mln.
20.92%
1 janv. 1980
897.546 mln.
+164.626 mln.
22.46%
1 janv. 1981
981.186 mln.
+83.64 mln.
9.32%
1 janv. 1982
823.254 mln.
-157.932 mln.
-16.1%
1 janv. 1983
715.675 mln.
-107.58 mln.
-13.07%
1 janv. 1984
711.266 mln.
-4.408 mln.
-0.62%
1 janv. 1985
705.173 mln.
-6.094 mln.
-0.86%
1 janv. 1986
727.83 mln.
+22.658 mln.
3.21%
1 janv. 1987
1.008 mds
+280.27 mln.
38.51%
1 janv. 1988
1.296 mds
+287.621 mln.
28.53%
1 janv. 1989
1.4 mds
+104.427 mln.
8.06%
1 janv. 1990
1.46 mds
+59.648 mln.
4.26%
1 janv. 1991
1.879 mds
+419.541 mln.
28.74%
1 janv. 1992
1.972 mds
+93.082 mln.
4.95%
1 janv. 1993
2.327 mds
+354.416 mln.
17.97%
1 janv. 1994
2.267 mds
-59.568 mln.
-2.56%
1 janv. 1995
2.483 mds
+215.298 mln.
9.5%
1 janv. 1996
2.941 mds
+458.888 mln.
18.48%
1 janv. 1997
2.962 mds
+20.957 mln.
0.71%
1 janv. 1998
2.669 mds
-293.639 mln.
-9.91%
1 janv. 1999
2.8 mds
+130.905 mln.
4.91%
1 janv. 2000
2.895 mds
+95.375 mln.
3.41%
1 janv. 2001
2.518 mds
-377.359 mln.
-13.03%
1 janv. 2002
2.702 mds
+184.414 mln.
7.32%
1 janv. 2003
3.095 mds
+393.135 mln.
14.55%
1 janv. 2004
3.871 mds
+775.755 mln.
25.06%
1 janv. 2005
4.501 mds
+629.628 mln.
16.27%
1 janv. 2006
4.85 mds
+349.025 mln.
7.76%
1 janv. 2007
5.218 mds
+368.018 mln.
7.59%
1 janv. 2008
6.081 mds
+863.092 mln.
16.54%
1 janv. 2009
6.964 mds
+883.504 mln.
14.53%
1 janv. 2010
6.908 mds
-56.646 mln.
-0.81%
1 janv. 2011
6.826 mds
-81.653 mln.
-1.18%
1 janv. 2012
7.557 mds
+730.615 mln.
10.7%
1 janv. 2013
7.363 mds
-193.415 mln.
-2.56%
1 janv. 2014
8.012 mds
+648.825 mln.
8.81%
1 janv. 2015
8.544 mds
+532.18 mln.
6.64%
Classement des pays selon les statistiques actuelles par années


Commentaires: