29
/fr/
fr
AIzaSyAYiBZKx7MnpbEhh9jyipgxe19OcubqV5w
April 1, 2024
85569
Bhutan
BTN
true
2
1
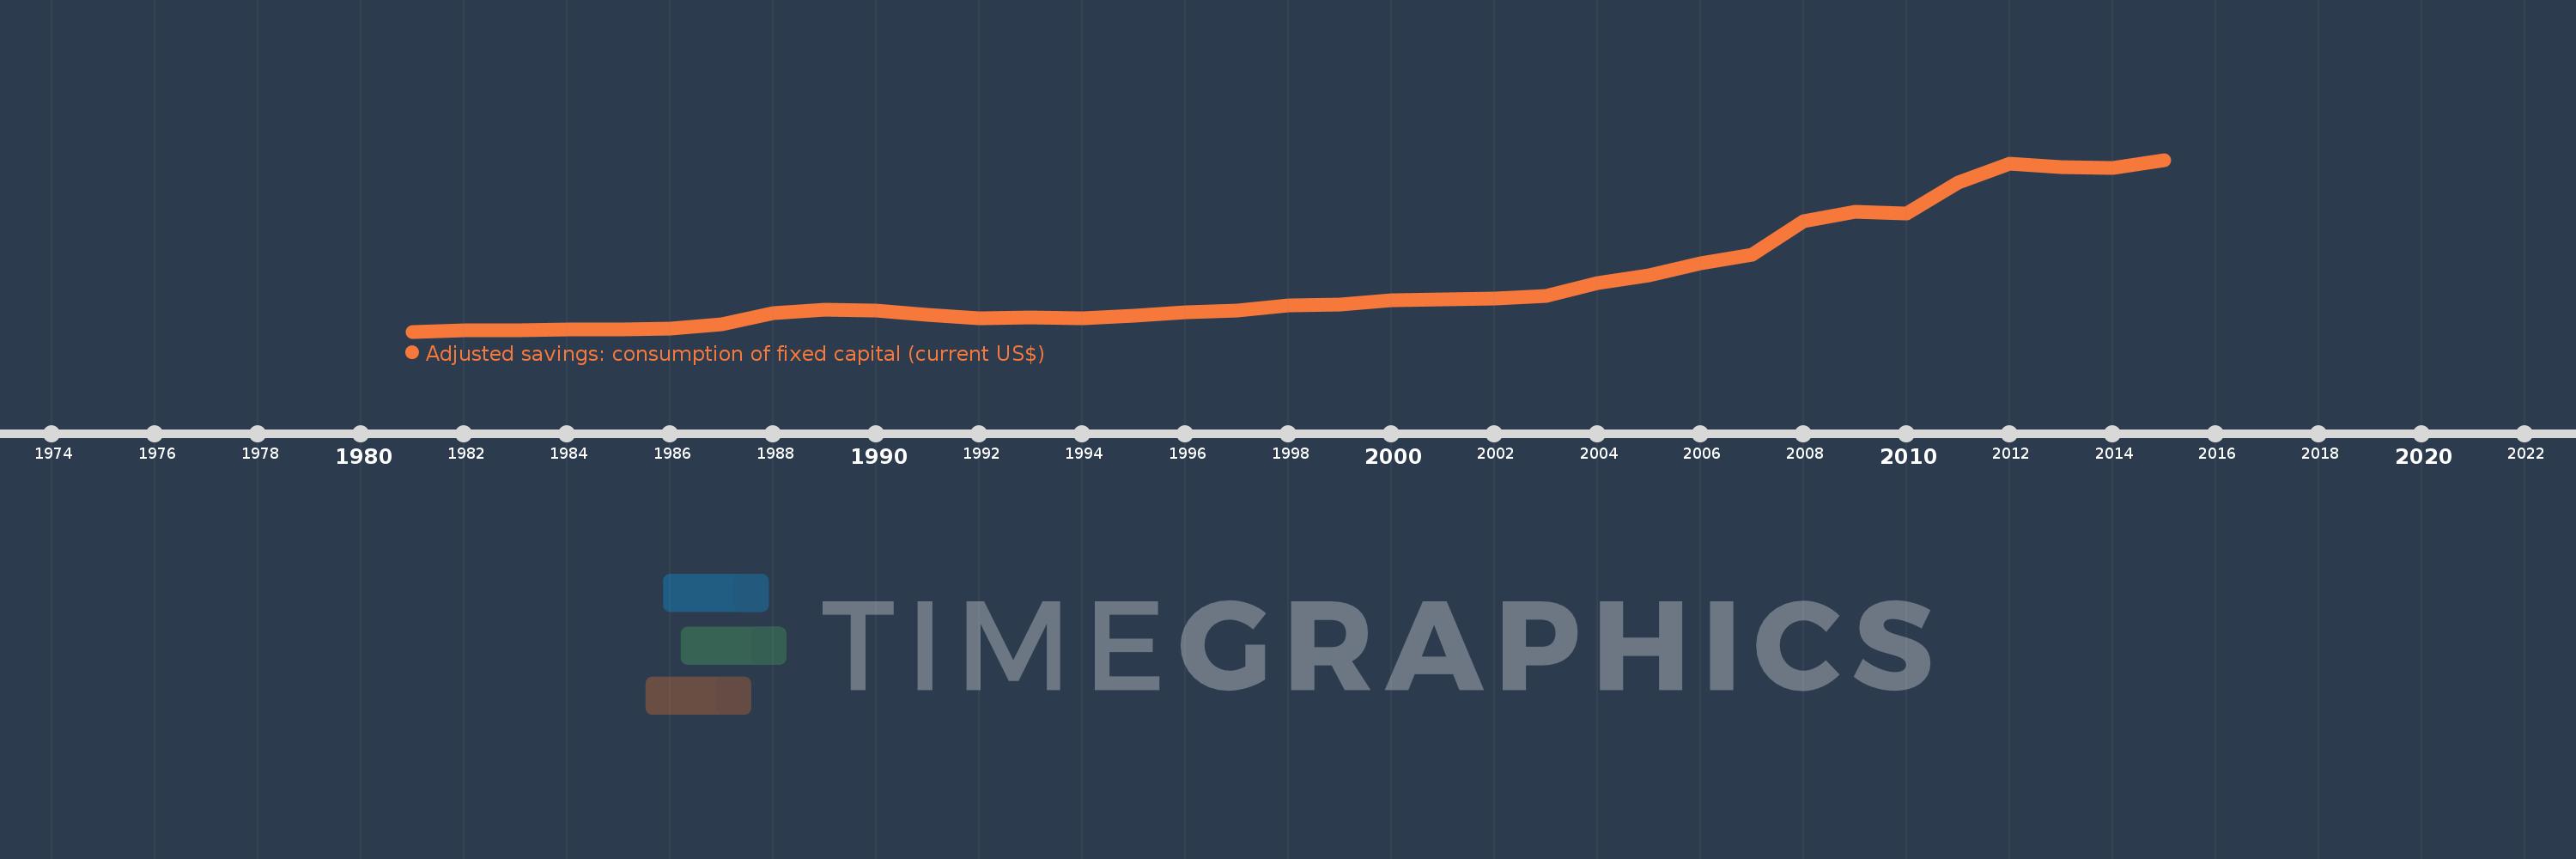
Adjusted savings: consumption of fixed capital (current US$)
2015,2014,2013,2012,2011,2010,2009,2008,2007,2006,2005,2004,2003,2002,2001,2000,1999,1998,1997,1996,1995,1994,1993,1992,1991,1990,1989,1988,1987,1986,1985,1984,1983,1982,1981
Cette statistique dans les autres pays:
AfghanistanAlbaniaAlgeriaAndorraAngolaAntigua and BarbudaArgentinaArmeniaArubaAustraliaAustriaAzerbaijanBahamas, TheBahrainBangladeshBarbadosBelarusBelgiumBelizeBeninBermudaBhutanBoliviaBosnia and HerzegovinaBotswanaBrazilBrunei DarussalamBulgariaBurkina FasoBurundiCabo VerdeCambodiaCameroonCanadaCayman IslandsCentral African RepublicChadChannel IslandsChileChinaColombiaComorosCongo, Dem. Rep.Congo, Rep.Costa RicaCote d'IvoireCroatiaCubaCyprusCzech RepublicDenmarkDjiboutiDominicaDominican RepublicEcuadorEgypt, Arab Rep.El SalvadorEquatorial GuineaEritreaEstoniaEthiopiaFaroe IslandsFijiFinlandFranceFrench PolynesiaGabonGambia, TheGeorgiaGermanyGhanaGreeceGreenlandGrenadaGuatemalaGuineaGuinea-BissauGuyanaHaitiHondurasHong Kong SAR, ChinaHungaryIcelandIndiaIndonesiaIran, Islamic Rep.IraqIrelandIsle of ManIsraelItalyJamaicaJapanJordanKazakhstanKenyaKiribatiKorea, Rep.KosovoKuwaitKyrgyz RepublicLao PDRLatviaLebanonLesothoLiberiaLibyaLiechtensteinLithuaniaLuxembourgMacao SAR, ChinaMacedonia, FYRMadagascarMalawiMalaysiaMaldivesMaliMaltaMarshall IslandsMauritaniaMauritiusMexicoMicronesia, Fed. Sts.MoldovaMonacoMongoliaMontenegroMoroccoMozambiqueMyanmarNamibiaNepalNetherlandsNew CaledoniaNew ZealandNicaraguaNigerNigeriaNorwayOmanPakistanPalauPanamaPapua New GuineaParaguayPeruPhilippinesPolandPortugalPuerto RicoQatarRomaniaRussian FederationRwandaSamoaSan MarinoSao Tome and PrincipeSaudi ArabiaSenegalSerbiaSeychellesSierra LeoneSingaporeSlovak RepublicSloveniaSolomon IslandsSomaliaSouth AfricaSouth SudanSpainSri LankaSt. Kitts and NevisSt. LuciaSt. Vincent and the GrenadinesSudanSurinameSwazilandSwedenSwitzerlandSyrian Arab RepublicTajikistanTanzaniaThailandTimor-LesteTogoTongaTrinidad and TobagoTunisiaTurkeyTurkmenistanTuvaluUgandaUkraineUnited Arab EmiratesUnited KingdomUnited StatesUruguayUzbekistanVanuatuVenezuela, RBVietnamVirgin Islands (U.S.)West Bank and GazaYemen, Rep.ZambiaZimbabwe La ligne de temps
Cette échelle de temps montre un graphique de 1981 année à 2015 année Bhutan. Les données jusqu'à 1980 année ne sont pas présentés. Quantité d'observations actuelles selon dates: 35.
Source (désignation):
Les indicateurs du développement mondiale
Source (organisation):
World Bank staff estimates using data from the United Nations Statistics Division's National Accounts Statistics.
Catégories:
Economy & Growth, Environment
Dernière mise à jour
23 avr. 2017
Les indicateurs de changement de valeurs selon les années
Minimum:
6.421 mln.
1 janv. 1981
Maximum:
143.02 mln.
1 janv. 2015
Pour la date d''observation
Valeur
Changement absolu
Le changement par rapport à la valeur précédente
1 janv. 1981
6.421 mln.
+6.421 mln.
0.0%
1 janv. 1982
7.182 mln.
+760.856 milles
11.85%
1 janv. 1983
7.306 mln.
+124.699 milles
1.74%
1 janv. 1984
8.266 mln.
+959.931 milles
13.14%
1 janv. 1985
8.262 mln.
-4.112 milles
-0.05%
1 janv. 1986
8.589 mln.
+326.452 milles
3.95%
1 janv. 1987
12.228 mln.
+3.639 mln.
42.37%
1 janv. 1988
21.263 mln.
+9.035 mln.
73.89%
1 janv. 1989
23.969 mln.
+2.706 mln.
12.73%
1 janv. 1990
23.013 mln.
-956.59 milles
-3.99%
1 janv. 1991
19.964 mln.
-3.049 mln.
-13.25%
1 janv. 1992
17.172 mln.
-2.791 mln.
-13.98%
1 janv. 1993
17.814 mln.
+641.954 milles
3.74%
1 janv. 1994
17.006 mln.
-808.627 milles
-4.54%
1 janv. 1995
19.021 mln.
+2.016 mln.
11.85%
1 janv. 1996
21.98 mln.
+2.959 mln.
15.55%
1 janv. 1997
23.195 mln.
+1.215 mln.
5.53%
1 janv. 1998
27.059 mln.
+3.865 mln.
16.66%
1 janv. 1999
27.662 mln.
+603.273 milles
2.23%
1 janv. 2000
31.106 mln.
+3.443 mln.
12.45%
1 janv. 2001
32.197 mln.
+1.092 mln.
3.51%
1 janv. 2002
32.82 mln.
+622.582 milles
1.93%
1 janv. 2003
34.854 mln.
+2.034 mln.
6.2%
1 janv. 2004
44.875 mln.
+10.021 mln.
28.75%
1 janv. 2005
51.02 mln.
+6.145 mln.
13.69%
1 janv. 2006
60.465 mln.
+9.445 mln.
18.51%
1 janv. 2007
67.724 mln.
+7.259 mln.
12.0%
1 janv. 2008
93.928 mln.
+26.204 mln.
38.69%
1 janv. 2009
101.388 mln.
+7.46 mln.
7.94%
1 janv. 2010
100.63 mln.
-758.001 milles
-0.75%
1 janv. 2011
124.612 mln.
+23.982 mln.
23.83%
1 janv. 2012
139.947 mln.
+15.335 mln.
12.31%
1 janv. 2013
137.13 mln.
-2.816 mln.
-2.01%
1 janv. 2014
136.857 mln.
-273.353 milles
-0.2%
1 janv. 2015
143.02 mln.
+6.163 mln.
4.5%
Classement des pays selon les statistiques actuelles par années


Commentaires: