29
/fr/
fr
AIzaSyAYiBZKx7MnpbEhh9jyipgxe19OcubqV5w
April 1, 2024
149924
Honduras
HND
true
2
1
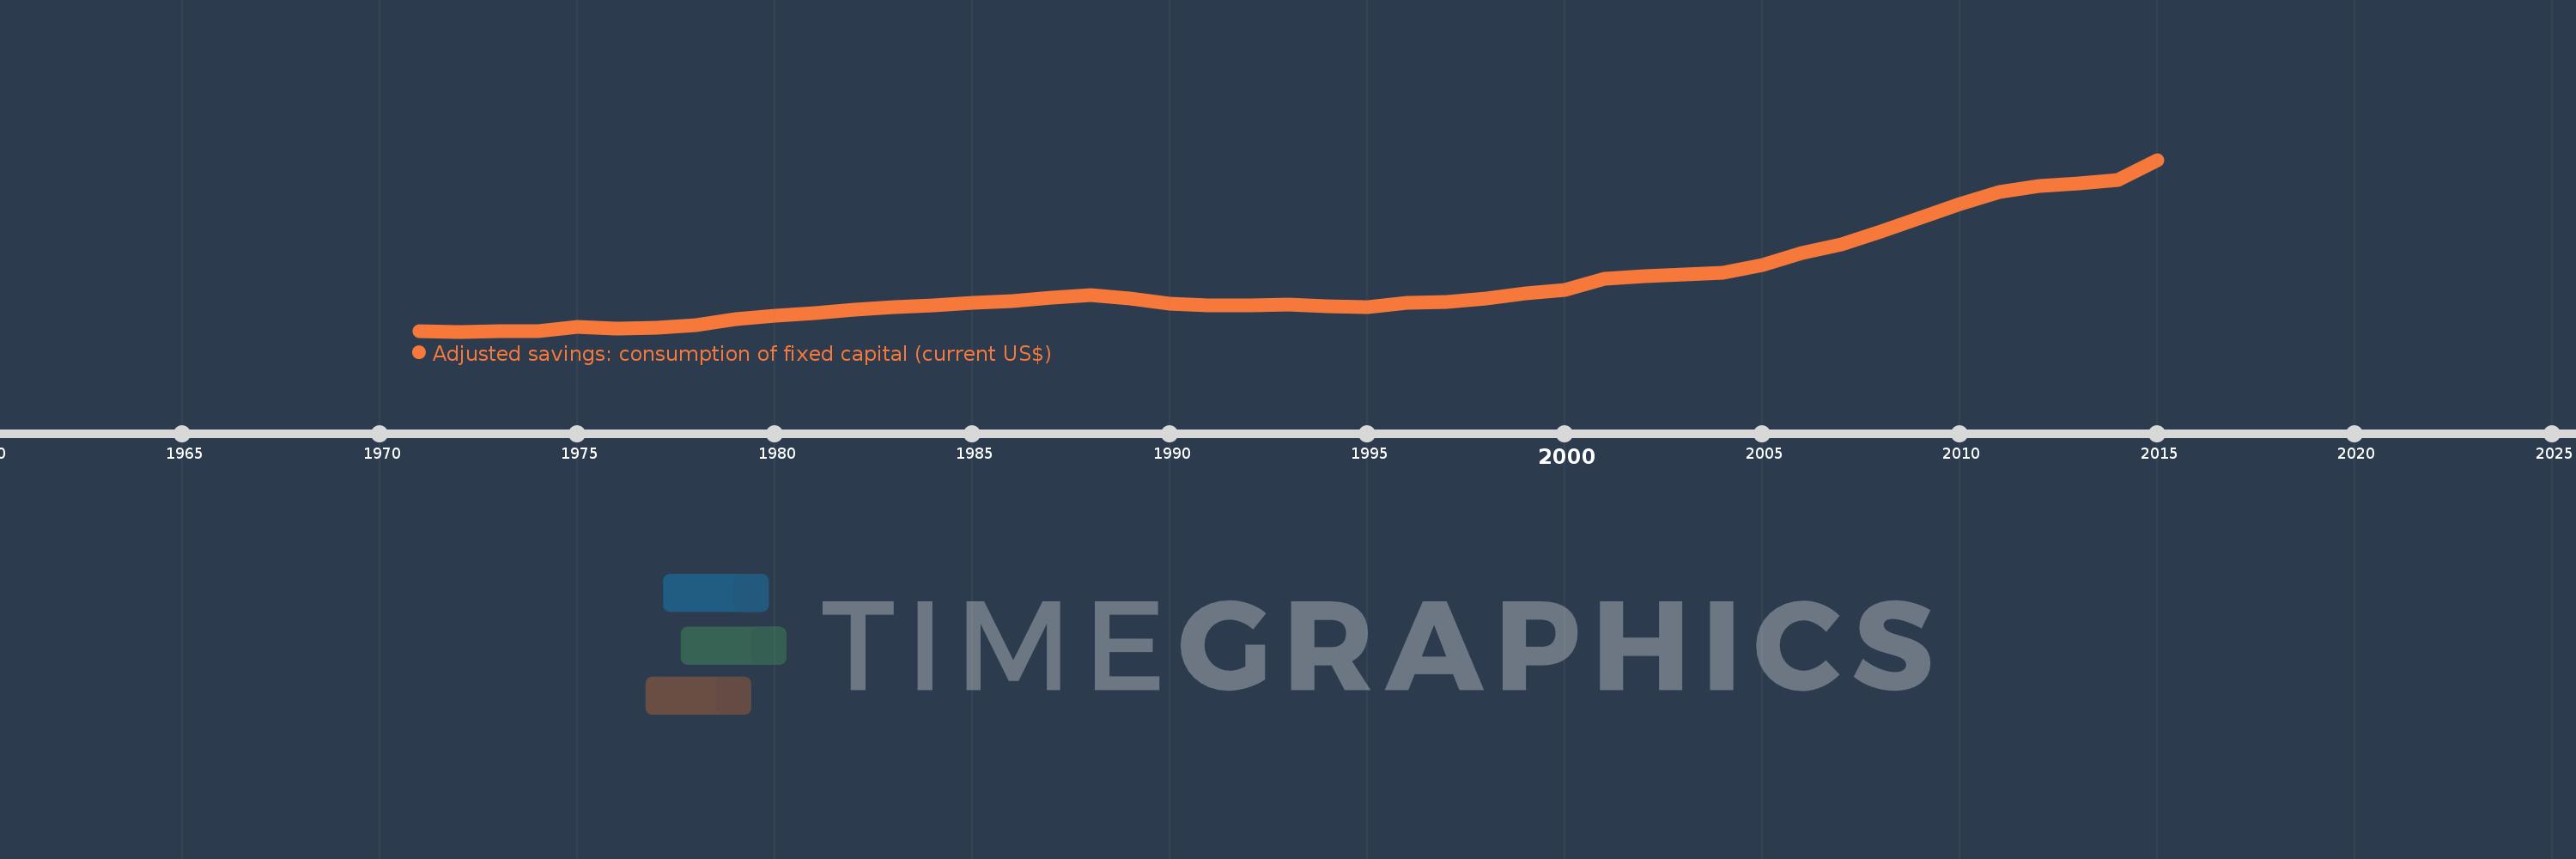
Adjusted savings: consumption of fixed capital (current US$)
2015,2014,2013,2012,2011,2010,2009,2008,2007,2006,2005,2004,2003,2002,2001,2000,1999,1998,1997,1996,1995,1994,1993,1992,1991,1990,1989,1988,1987,1986,1985,1984,1983,1982,1981,1980,1979,1978,1977,1976,1975,1974,1973,1972,1971
Cette statistique dans les autres pays:
AfghanistanAlbaniaAlgeriaAndorraAngolaAntigua and BarbudaArgentinaArmeniaArubaAustraliaAustriaAzerbaijanBahamas, TheBahrainBangladeshBarbadosBelarusBelgiumBelizeBeninBermudaBhutanBoliviaBosnia and HerzegovinaBotswanaBrazilBrunei DarussalamBulgariaBurkina FasoBurundiCabo VerdeCambodiaCameroonCanadaCayman IslandsCentral African RepublicChadChannel IslandsChileChinaColombiaComorosCongo, Dem. Rep.Congo, Rep.Costa RicaCote d'IvoireCroatiaCubaCyprusCzech RepublicDenmarkDjiboutiDominicaDominican RepublicEcuadorEgypt, Arab Rep.El SalvadorEquatorial GuineaEritreaEstoniaEthiopiaFaroe IslandsFijiFinlandFranceFrench PolynesiaGabonGambia, TheGeorgiaGermanyGhanaGreeceGreenlandGrenadaGuatemalaGuineaGuinea-BissauGuyanaHaitiHondurasHong Kong SAR, ChinaHungaryIcelandIndiaIndonesiaIran, Islamic Rep.IraqIrelandIsle of ManIsraelItalyJamaicaJapanJordanKazakhstanKenyaKiribatiKorea, Rep.KosovoKuwaitKyrgyz RepublicLao PDRLatviaLebanonLesothoLiberiaLibyaLiechtensteinLithuaniaLuxembourgMacao SAR, ChinaMacedonia, FYRMadagascarMalawiMalaysiaMaldivesMaliMaltaMarshall IslandsMauritaniaMauritiusMexicoMicronesia, Fed. Sts.MoldovaMonacoMongoliaMontenegroMoroccoMozambiqueMyanmarNamibiaNepalNetherlandsNew CaledoniaNew ZealandNicaraguaNigerNigeriaNorwayOmanPakistanPalauPanamaPapua New GuineaParaguayPeruPhilippinesPolandPortugalPuerto RicoQatarRomaniaRussian FederationRwandaSamoaSan MarinoSao Tome and PrincipeSaudi ArabiaSenegalSerbiaSeychellesSierra LeoneSingaporeSlovak RepublicSloveniaSolomon IslandsSomaliaSouth AfricaSouth SudanSpainSri LankaSt. Kitts and NevisSt. LuciaSt. Vincent and the GrenadinesSudanSurinameSwazilandSwedenSwitzerlandSyrian Arab RepublicTajikistanTanzaniaThailandTimor-LesteTogoTongaTrinidad and TobagoTunisiaTurkeyTurkmenistanTuvaluUgandaUkraineUnited Arab EmiratesUnited KingdomUnited StatesUruguayUzbekistanVanuatuVenezuela, RBVietnamVirgin Islands (U.S.)West Bank and GazaYemen, Rep.ZambiaZimbabwe La ligne de temps
Cette échelle de temps montre un graphique de 1971 année à 2015 année Honduras. Les données jusqu'à 1970 année ne sont pas présentés. Quantité d'observations actuelles selon dates: 45.
Source (désignation):
Les indicateurs du développement mondiale
Source (organisation):
World Bank staff estimates using data from the United Nations Statistics Division's National Accounts Statistics.
Catégories:
Economy & Growth, Environment
Dernière mise à jour
23 avr. 2017
Les indicateurs de changement de valeurs selon les années
Minimum:
23.161 mln.
1 janv. 1972
Maximum:
1.142 mds
1 janv. 2015
Pour la date d''observation
Valeur
Changement absolu
Le changement par rapport à la valeur précédente
1 janv. 1971
23.436 mln.
+23.436 mln.
0.0%
1 janv. 1972
23.161 mln.
-274.688 milles
-1.17%
1 janv. 1973
23.734 mln.
+572.67 milles
2.47%
1 janv. 1974
25.084 mln.
+1.35 mln.
5.69%
1 janv. 1975
52.86 mln.
+27.776 mln.
110.73%
1 janv. 1976
40.829 mln.
-12.031 mln.
-22.76%
1 janv. 1977
49.499 mln.
+8.671 mln.
21.24%
1 janv. 1978
67.091 mln.
+17.592 mln.
35.54%
1 janv. 1979
105.048 mln.
+37.957 mln.
56.57%
1 janv. 1980
127.137 mln.
+22.089 mln.
21.03%
1 janv. 1981
145.27 mln.
+18.133 mln.
14.26%
1 janv. 1982
163.266 mln.
+17.995 mln.
12.39%
1 janv. 1983
179.767 mln.
+16.501 mln.
10.11%
1 janv. 1984
195.238 mln.
+15.47 mln.
8.61%
1 janv. 1985
211.301 mln.
+16.064 mln.
8.23%
1 janv. 1986
221.899 mln.
+10.598 mln.
5.02%
1 janv. 1987
244.396 mln.
+22.497 mln.
10.14%
1 janv. 1988
260.854 mln.
+16.458 mln.
6.73%
1 janv. 1989
237.379 mln.
-23.475 mln.
-9.0%
1 janv. 1990
204.368 mln.
-33.012 mln.
-13.91%
1 janv. 1991
193.968 mln.
-10.4 mln.
-5.09%
1 janv. 1992
191.505 mln.
-2.463 mln.
-1.27%
1 janv. 1993
200.517 mln.
+9.012 mln.
4.71%
1 janv. 1994
189.889 mln.
-10.627 mln.
-5.3%
1 janv. 1995
182.63 mln.
-7.259 mln.
-3.82%
1 janv. 1996
212.241 mln.
+29.611 mln.
16.21%
1 janv. 1997
216.345 mln.
+4.104 mln.
1.93%
1 janv. 1998
240.609 mln.
+24.265 mln.
11.22%
1 janv. 1999
270.897 mln.
+30.287 mln.
12.59%
1 janv. 2000
291.807 mln.
+20.91 mln.
7.72%
1 janv. 2001
365.797 mln.
+73.99 mln.
25.36%
1 janv. 2002
386.45 mln.
+20.653 mln.
5.65%
1 janv. 2003
396.622 mln.
+10.172 mln.
2.63%
1 janv. 2004
403.609 mln.
+6.987 mln.
1.76%
1 janv. 2005
457.854 mln.
+54.245 mln.
13.44%
1 janv. 2006
537.473 mln.
+79.619 mln.
17.39%
1 janv. 2007
588.289 mln.
+50.816 mln.
9.45%
1 janv. 2008
672.799 mln.
+84.509 mln.
14.37%
1 janv. 2009
764.744 mln.
+91.945 mln.
13.67%
1 janv. 2010
854.444 mln.
+89.701 mln.
11.73%
1 janv. 2011
932.131 mln.
+77.687 mln.
9.09%
1 janv. 2012
970.335 mln.
+38.204 mln.
4.1%
1 janv. 2013
988.227 mln.
+17.892 mln.
1.84%
1 janv. 2014
1.01 mds
+21.543 mln.
2.18%
1 janv. 2015
1.142 mds
+131.876 mln.
13.06%
Classement des pays selon les statistiques actuelles par années


Commentaires: