29
/fr/
fr
AIzaSyAYiBZKx7MnpbEhh9jyipgxe19OcubqV5w
April 1, 2024
260464
Tanzania
TZA
true
2
1
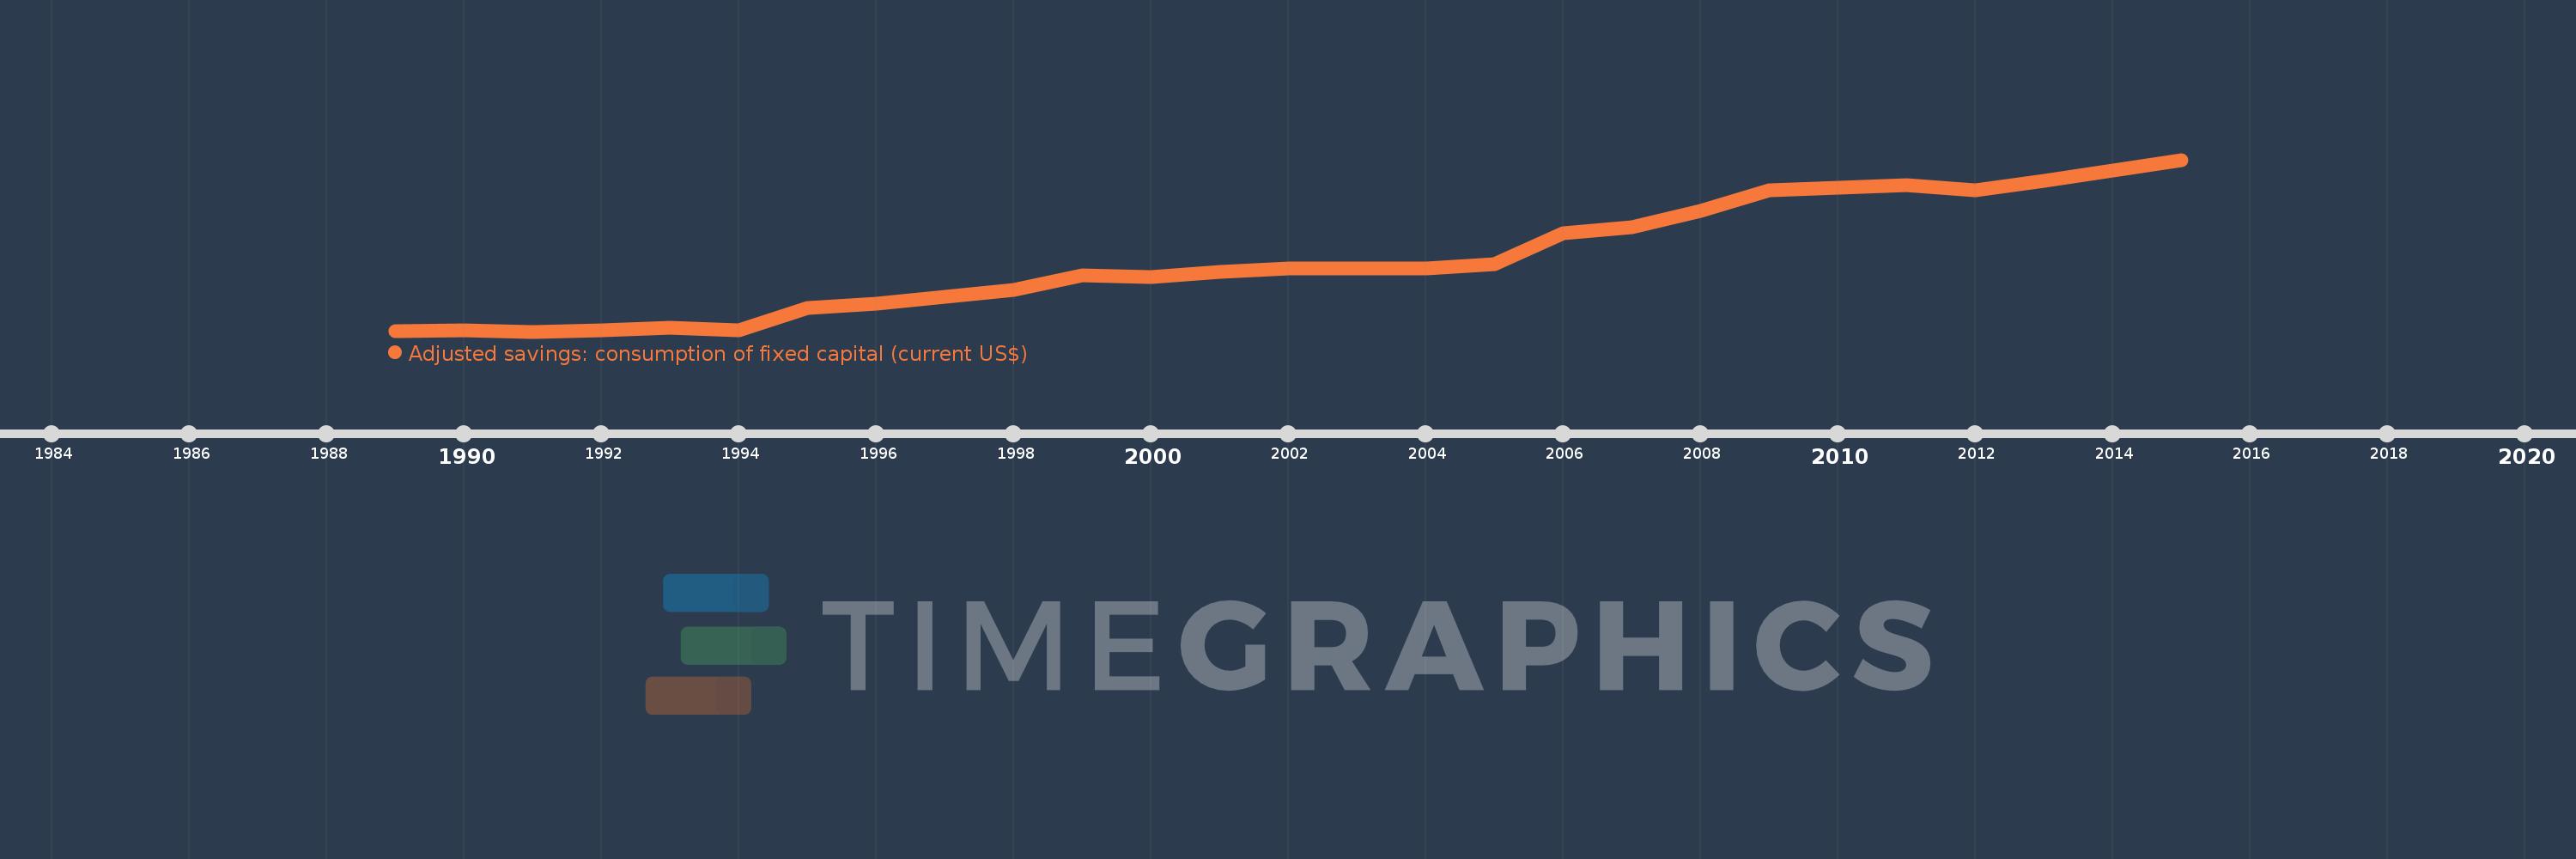
Adjusted savings: consumption of fixed capital (current US$)
2015,2014,2013,2012,2011,2010,2009,2008,2007,2006,2005,2004,2003,2002,2001,2000,1999,1998,1997,1996,1995,1994,1993,1992,1991,1990,1989
Cette statistique dans les autres pays:
AfghanistanAlbaniaAlgeriaAndorraAngolaAntigua and BarbudaArgentinaArmeniaArubaAustraliaAustriaAzerbaijanBahamas, TheBahrainBangladeshBarbadosBelarusBelgiumBelizeBeninBermudaBhutanBoliviaBosnia and HerzegovinaBotswanaBrazilBrunei DarussalamBulgariaBurkina FasoBurundiCabo VerdeCambodiaCameroonCanadaCayman IslandsCentral African RepublicChadChannel IslandsChileChinaColombiaComorosCongo, Dem. Rep.Congo, Rep.Costa RicaCote d'IvoireCroatiaCubaCyprusCzech RepublicDenmarkDjiboutiDominicaDominican RepublicEcuadorEgypt, Arab Rep.El SalvadorEquatorial GuineaEritreaEstoniaEthiopiaFaroe IslandsFijiFinlandFranceFrench PolynesiaGabonGambia, TheGeorgiaGermanyGhanaGreeceGreenlandGrenadaGuatemalaGuineaGuinea-BissauGuyanaHaitiHondurasHong Kong SAR, ChinaHungaryIcelandIndiaIndonesiaIran, Islamic Rep.IraqIrelandIsle of ManIsraelItalyJamaicaJapanJordanKazakhstanKenyaKiribatiKorea, Rep.KosovoKuwaitKyrgyz RepublicLao PDRLatviaLebanonLesothoLiberiaLibyaLiechtensteinLithuaniaLuxembourgMacao SAR, ChinaMacedonia, FYRMadagascarMalawiMalaysiaMaldivesMaliMaltaMarshall IslandsMauritaniaMauritiusMexicoMicronesia, Fed. Sts.MoldovaMonacoMongoliaMontenegroMoroccoMozambiqueMyanmarNamibiaNepalNetherlandsNew CaledoniaNew ZealandNicaraguaNigerNigeriaNorwayOmanPakistanPalauPanamaPapua New GuineaParaguayPeruPhilippinesPolandPortugalPuerto RicoQatarRomaniaRussian FederationRwandaSamoaSan MarinoSao Tome and PrincipeSaudi ArabiaSenegalSerbiaSeychellesSierra LeoneSingaporeSlovak RepublicSloveniaSolomon IslandsSomaliaSouth AfricaSouth SudanSpainSri LankaSt. Kitts and NevisSt. LuciaSt. Vincent and the GrenadinesSudanSurinameSwazilandSwedenSwitzerlandSyrian Arab RepublicTajikistanTanzaniaThailandTimor-LesteTogoTongaTrinidad and TobagoTunisiaTurkeyTurkmenistanTuvaluUgandaUkraineUnited Arab EmiratesUnited KingdomUnited StatesUruguayUzbekistanVanuatuVenezuela, RBVietnamVirgin Islands (U.S.)West Bank and GazaYemen, Rep.ZambiaZimbabwe La ligne de temps
Cette échelle de temps montre un graphique de 1989 année à 2015 année Tanzania. Les données jusqu'à 1988 année ne sont pas présentés. Quantité d'observations actuelles selon dates: 27.
Source (désignation):
Les indicateurs du développement mondiale
Source (organisation):
World Bank staff estimates using data from the United Nations Statistics Division's National Accounts Statistics.
Catégories:
Economy & Growth, Environment
Dernière mise à jour
23 avr. 2017
Les indicateurs de changement de valeurs selon les années
Minimum:
79.404 mln.
1 janv. 1991
Maximum:
3.111 mds
1 janv. 2015
Pour la date d''observation
Valeur
Changement absolu
Le changement par rapport à la valeur précédente
1 janv. 1989
91.394 mln.
+91.394 mln.
0.0%
1 janv. 1990
105.146 mln.
+13.752 mln.
15.05%
1 janv. 1991
79.404 mln.
-25.741 mln.
-24.48%
1 janv. 1992
99.717 mln.
+20.312 mln.
25.58%
1 janv. 1993
141.778 mln.
+42.062 mln.
42.18%
1 janv. 1994
107.894 mln.
-33.884 mln.
-23.9%
1 janv. 1995
492.025 mln.
+384.131 mln.
356.03%
1 janv. 1996
575.626 mln.
+83.601 mln.
16.99%
1 janv. 1997
693.65 mln.
+118.024 mln.
20.5%
1 janv. 1998
818.762 mln.
+125.112 mln.
18.04%
1 janv. 1999
1.078 mds
+258.946 mln.
31.63%
1 janv. 2000
1.045 mds
-32.229 mln.
-2.99%
1 janv. 2001
1.14 mds
+94.905 mln.
9.08%
1 janv. 2002
1.187 mds
+47.008 mln.
4.12%
1 janv. 2003
1.199 mds
+11.154 mln.
0.94%
1 janv. 2004
1.192 mds
-6.224 mln.
-0.52%
1 janv. 2005
1.275 mds
+82.665 mln.
6.93%
1 janv. 2006
1.817 mds
+542.105 mln.
42.52%
1 janv. 2007
1.925 mds
+107.853 mln.
5.94%
1 janv. 2008
2.214 mds
+289.414 mln.
15.03%
1 janv. 2009
2.57 mds
+355.6 mln.
16.06%
1 janv. 2010
2.615 mds
+44.883 mln.
1.75%
1 janv. 2011
2.66 mds
+45.509 mln.
1.74%
1 janv. 2012
2.567 mds
-93.787 mln.
-3.53%
1 janv. 2013
2.744 mds
+177.219 mln.
6.9%
1 janv. 2014
2.926 mds
+181.851 mln.
6.63%
1 janv. 2015
3.111 mds
+185.431 mln.
6.34%
Classement des pays selon les statistiques actuelles par années


Commentaires: