29
/es/
es
AIzaSyAYiBZKx7MnpbEhh9jyipgxe19OcubqV5w
April 1, 2024
96118
Burundi
BDI
true
2
1
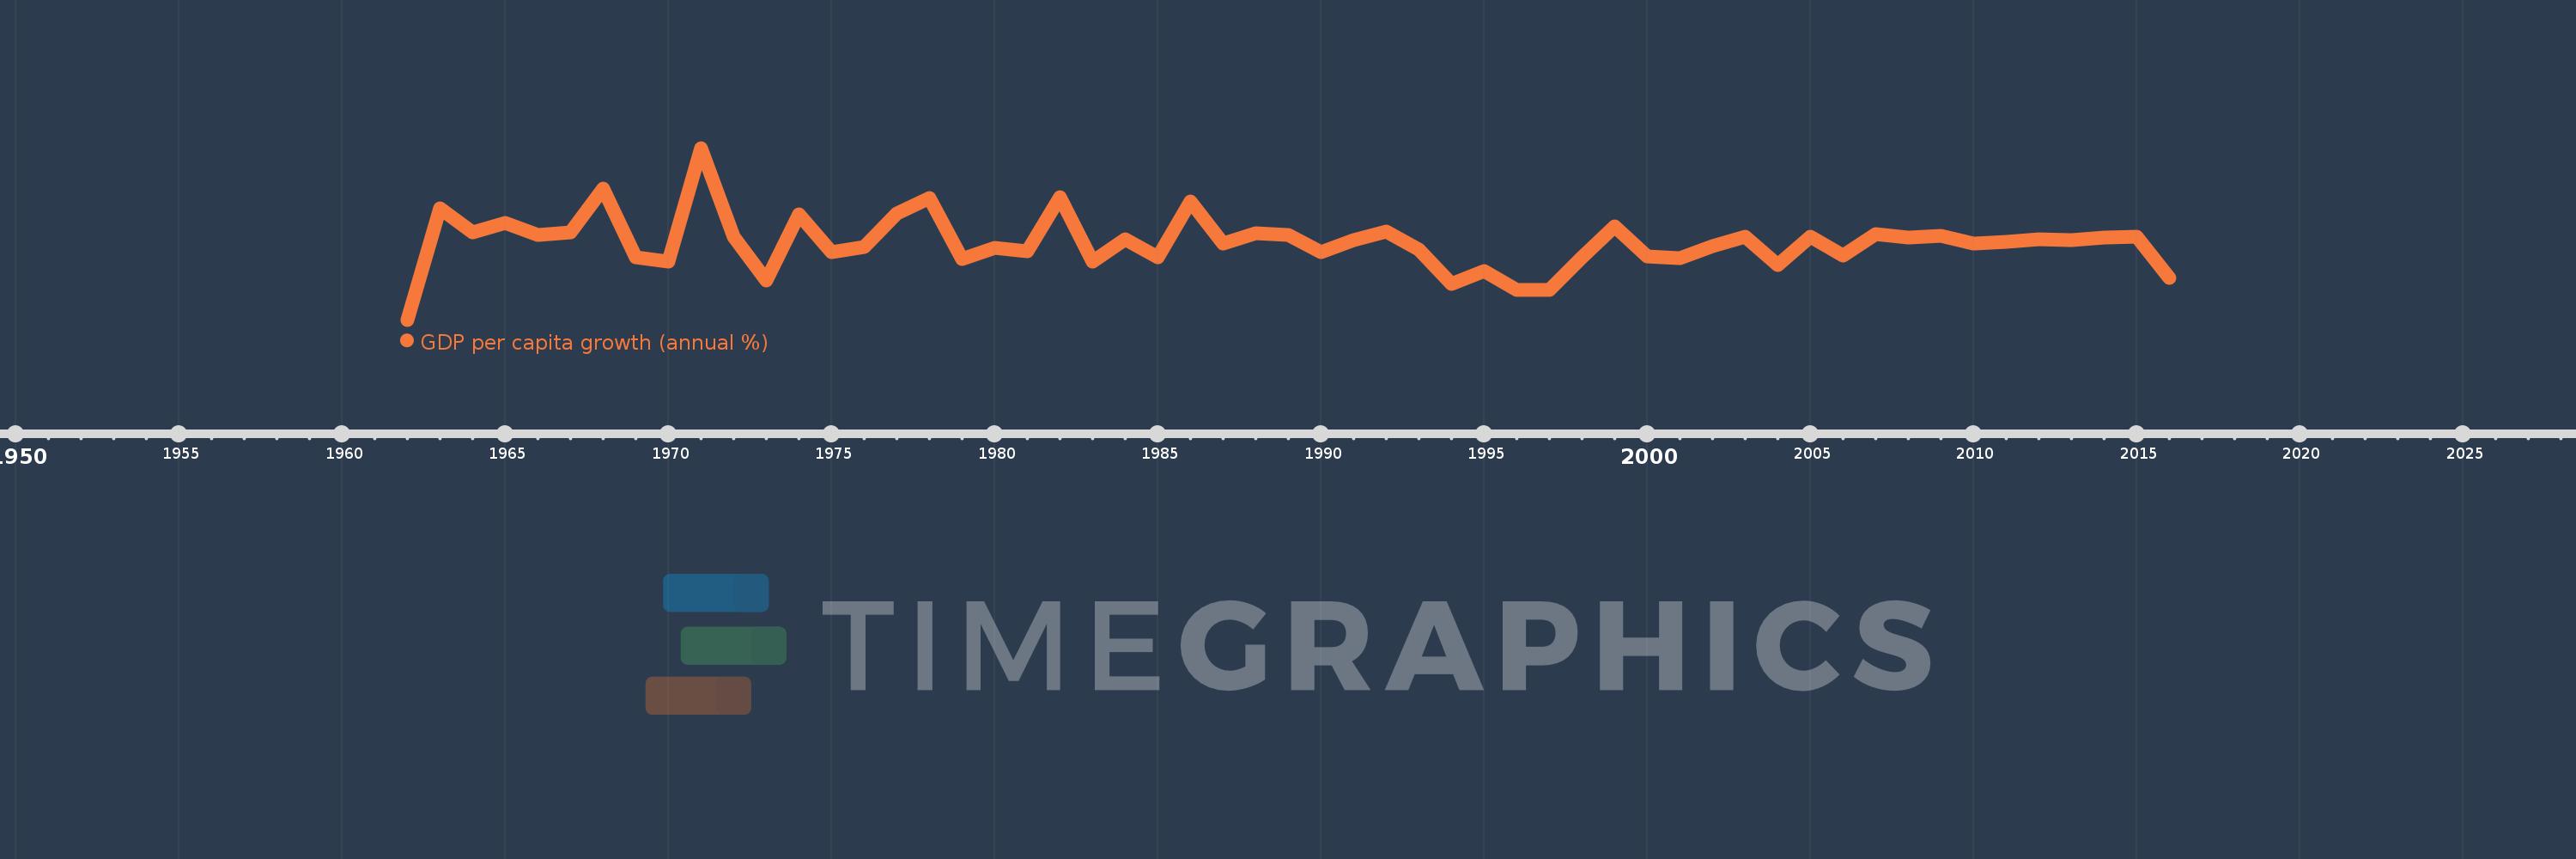
GDP per capita growth (annual %)
2016,2015,2014,2013,2012,2011,2010,2009,2008,2007,2006,2005,2004,2003,2002,2001,2000,1999,1998,1997,1996,1995,1994,1993,1992,1991,1990,1989,1988,1987,1986,1985,1984,1983,1982,1981,1980,1979,1978,1977,1976,1975,1974,1973,1972,1971,1970,1969,1968,1967,1966,1965,1964,1963,1962
Estas estadísticas en otros países:
AfghanistanAlbaniaAlgeriaAndorraAngolaAntigua and BarbudaArab WorldArgentinaArmeniaArubaAustraliaAustriaAzerbaijanBahamas, TheBahrainBangladeshBarbadosBelarusBelgiumBelizeBeninBermudaBhutanBoliviaBosnia and HerzegovinaBotswanaBrazilBrunei DarussalamBulgariaBurkina FasoBurundiCabo VerdeCambodiaCameroonCanadaCaribbean small statesCayman IslandsCentral African RepublicCentral Europe and the BalticsChadChannel IslandsChileChinaColombiaComorosCongo, Dem. Rep.Congo, Rep.Costa RicaCote d'IvoireCroatiaCubaCyprusCzech RepublicDenmarkDjiboutiDominicaDominican RepublicEarly-demographic dividendEast Asia & PacificEast Asia & Pacific (excluding high income)East Asia & Pacific (IDA & IBRD countries)EcuadorEgypt, Arab Rep.El SalvadorEquatorial GuineaEritreaEstoniaEthiopiaEuro areaEurope & Central AsiaEurope & Central Asia (excluding high income)Europe & Central Asia (IDA & IBRD countries)European UnionFijiFinlandFragile and conflict affected situationsFranceFrench PolynesiaGabonGambia, TheGeorgiaGermanyGhanaGreeceGreenlandGrenadaGuatemalaGuineaGuinea-BissauGuyanaHaitiHeavily indebted poor countries (HIPC)High incomeHondurasHong Kong SAR, ChinaHungaryIBRD onlyIcelandIDA & IBRD totalIDA blendIDA onlyIDA totalIndiaIndonesiaIran, Islamic Rep.IraqIrelandIsle of ManIsraelItalyJamaicaJapanJordanKazakhstanKenyaKiribatiKorea, Rep.KosovoKuwaitKyrgyz RepublicLao PDRLate-demographic dividendLatin America & Caribbean Latin America & Caribbean (excluding high income)Latin America & the Caribbean (IDA & IBRD countries)LatviaLeast developed countries: UN classificationLebanonLesothoLiberiaLibyaLiechtensteinLithuaniaLow & middle incomeLow incomeLower middle incomeLuxembourgMacao SAR, ChinaMacedonia, FYRMadagascarMalawiMalaysiaMaldivesMaliMaltaMarshall IslandsMauritaniaMauritiusMexicoMicronesia, Fed. Sts.Middle East & North AfricaMiddle East & North Africa (excluding high income)Middle East & North Africa (IDA & IBRD countries)Middle incomeMoldovaMonacoMongoliaMontenegroMoroccoMozambiqueMyanmarNamibiaNauruNepalNetherlandsNew CaledoniaNew ZealandNicaraguaNigerNigeriaNorth AmericaNorwayOECD membersOmanOther small statesPacific island small statesPakistanPalauPanamaPapua New GuineaParaguayPeruPhilippinesPolandPortugalPost-demographic dividendPre-demographic dividendPuerto RicoQatarRomaniaRussian FederationRwandaSamoaSan MarinoSao Tome and PrincipeSaudi ArabiaSenegalSerbiaSeychellesSierra LeoneSingaporeSlovak RepublicSloveniaSmall statesSolomon IslandsSomaliaSouth AfricaSouth AsiaSouth Asia (IDA & IBRD)South SudanSpainSri LankaSt. Kitts and NevisSt. LuciaSt. Vincent and the GrenadinesSub-Saharan Africa Sub-Saharan Africa (excluding high income)Sub-Saharan Africa (IDA & IBRD countries)SudanSurinameSwazilandSwedenSwitzerlandSyrian Arab RepublicTajikistanTanzaniaThailandTimor-LesteTogoTongaTrinidad and TobagoTunisiaTurkeyTurkmenistanTuvaluUgandaUkraineUnited Arab EmiratesUnited KingdomUnited StatesUpper middle incomeUruguayUzbekistanVanuatuVenezuela, RBVietnamVirgin Islands (U.S.)West Bank and GazaWorldYemen, Rep.ZambiaZimbabwe línea de tiempo (timeline):
En esta escala de tiempo se presenta un gráfico de 1962 y 2016 de Burundi. Los datos de 1961 están ausentes. El número de observaciones reales por fecha: 55.
Fuente (nombre):
Indicadores del desarrollo mundial
Fuente (organización):
World Bank national accounts data, and OECD National Accounts data files.
Categorías:
Economy & Growth
Se ha actualizado:
23 abr 2017 año
Los indicadores de los cambios de valor en los últimos años
Mínimo:
-15.375
1 ene 1962 año
Máximo:
19.074
1 ene 1971 año
A la fecha de observación
Valor
Cambio absoluto
El cambio con respecto al valor anterior
1 ene 1962 año
-15.375
-15.375
0.0%
1 ene 1963 año
7.023
+22.398
-145.68%
1 ene 1964 año
2.145
-4.878
-69.45%
1 ene 1965 año
4.119
+1.973
91.99%
1 ene 1966 año
1.702
-2.417
-58.67%
1 ene 1967 año
2.13
+0.428
25.15%
1 ene 1968 año
10.963
+8.833
414.6%
1 ene 1969 año
-2.768
-13.731
-125.25%
1 ene 1970 año
-3.656
-0.888
32.08%
1 ene 1971 año
19.074
+22.73
-621.69%
1 ene 1972 año
1.268
-17.806
-93.35%
1 ene 1973 año
-7.453
-8.721
-687.68%
1 ene 1974 año
5.827
+13.279
-178.18%
1 ene 1975 año
-1.847
-7.674
-131.71%
1 ene 1976 año
-0.757
+1.09
-59.0%
1 ene 1977 año
5.991
+6.748
-891.09%
1 ene 1978 año
9.115
+3.124
52.15%
1 ene 1979 año
-3.276
-12.392
-135.94%
1 ene 1980 año
-0.892
+2.385
-72.79%
1 ene 1981 año
-1.643
-0.751
84.26%
1 ene 1982 año
9.17
+10.813
-658.25%
1 ene 1983 año
-3.765
-12.935
-141.06%
1 ene 1984 año
0.768
+4.533
-120.4%
1 ene 1985 año
-2.833
-3.601
-468.83%
1 ene 1986 año
8.28
+11.113
-392.23%
1 ene 1987 año
-0.142
-8.421
-101.71%
1 ene 1988 año
1.948
+2.09
-1.47 mil%
1 ene 1989 año
1.541
-0.407
-20.89%
1 ene 1990 año
-1.815
-3.356
-217.78%
1 ene 1991 año
0.574
+2.389
-131.64%
1 ene 1992 año
2.33
+1.756
305.77%
1 ene 1993 año
-1.315
-3.645
-156.45%
1 ene 1994 año
-8.183
-6.868
522.22%
1 ene 1995 año
-5.619
+2.564
-31.33%
1 ene 1996 año
-9.47
-3.85
68.51%
1 ene 1997 año
-9.371
+0.098
-1.04%
1 ene 1998 año
-2.923
+6.448
-68.81%
1 ene 1999 año
3.278
+6.201
-212.13%
1 ene 2000 año
-2.681
-5.958
-181.78%
1 ene 2001 año
-2.957
-0.277
10.32%
1 ene 2002 año
-0.583
+2.374
-80.27%
1 ene 2003 año
1.336
+1.92
-329.07%
1 ene 2004 año
-4.444
-5.781
-432.53%
1 ene 2005 año
1.271
+5.715
-128.59%
1 ene 2006 año
-2.567
-3.837
-302.0%
1 ene 2007 año
1.745
+4.311
-167.97%
1 ene 2008 año
1.137
-0.608
-34.84%
1 ene 2009 año
1.39
+0.253
22.26%
1 ene 2010 año
-0.11
-1.499
-107.88%
1 ene 2011 año
0.239
+0.349
-318.14%
1 ene 2012 año
0.69
+0.451
188.6%
1 ene 2013 año
0.584
-0.106
-15.41%
1 ene 2014 año
1.182
+0.599
102.61%
1 ene 2015 año
1.266
+0.083
7.05%
1 ene 2016 año
-7.017
-8.283
-654.42%
Ranking de los países por los datos estadísticos actuales


Comentarios: