29
/es/
es
AIzaSyAYiBZKx7MnpbEhh9jyipgxe19OcubqV5w
April 1, 2024
67158
Andorra
AND
true
2
1
GDP per capita growth (annual %)
2014,2013,2012,2011,2010,2009,2008,2007,2006,2005,2004,2003,2002,2001,2000,1999,1998,1997,1996,1995,1994,1993,1992,1991,1990,1989,1988,1987,1986,1985,1984,1983,1982,1981,1980,1979,1978,1977,1976,1975,1974,1973,1972
Estas estadísticas en otros países:
AfghanistanAlbaniaAlgeriaAndorraAngolaAntigua and BarbudaArab WorldArgentinaArmeniaArubaAustraliaAustriaAzerbaijanBahamas, TheBahrainBangladeshBarbadosBelarusBelgiumBelizeBeninBermudaBhutanBoliviaBosnia and HerzegovinaBotswanaBrazilBrunei DarussalamBulgariaBurkina FasoBurundiCabo VerdeCambodiaCameroonCanadaCaribbean small statesCayman IslandsCentral African RepublicCentral Europe and the BalticsChadChannel IslandsChileChinaColombiaComorosCongo, Dem. Rep.Congo, Rep.Costa RicaCote d'IvoireCroatiaCubaCyprusCzech RepublicDenmarkDjiboutiDominicaDominican RepublicEarly-demographic dividendEast Asia & PacificEast Asia & Pacific (excluding high income)East Asia & Pacific (IDA & IBRD countries)EcuadorEgypt, Arab Rep.El SalvadorEquatorial GuineaEritreaEstoniaEthiopiaEuro areaEurope & Central AsiaEurope & Central Asia (excluding high income)Europe & Central Asia (IDA & IBRD countries)European UnionFijiFinlandFragile and conflict affected situationsFranceFrench PolynesiaGabonGambia, TheGeorgiaGermanyGhanaGreeceGreenlandGrenadaGuatemalaGuineaGuinea-BissauGuyanaHaitiHeavily indebted poor countries (HIPC)High incomeHondurasHong Kong SAR, ChinaHungaryIBRD onlyIcelandIDA & IBRD totalIDA blendIDA onlyIDA totalIndiaIndonesiaIran, Islamic Rep.IraqIrelandIsle of ManIsraelItalyJamaicaJapanJordanKazakhstanKenyaKiribatiKorea, Rep.KosovoKuwaitKyrgyz RepublicLao PDRLate-demographic dividendLatin America & Caribbean Latin America & Caribbean (excluding high income)Latin America & the Caribbean (IDA & IBRD countries)LatviaLeast developed countries: UN classificationLebanonLesothoLiberiaLibyaLiechtensteinLithuaniaLow & middle incomeLow incomeLower middle incomeLuxembourgMacao SAR, ChinaMacedonia, FYRMadagascarMalawiMalaysiaMaldivesMaliMaltaMarshall IslandsMauritaniaMauritiusMexicoMicronesia, Fed. Sts.Middle East & North AfricaMiddle East & North Africa (excluding high income)Middle East & North Africa (IDA & IBRD countries)Middle incomeMoldovaMonacoMongoliaMontenegroMoroccoMozambiqueMyanmarNamibiaNauruNepalNetherlandsNew CaledoniaNew ZealandNicaraguaNigerNigeriaNorth AmericaNorwayOECD membersOmanOther small statesPacific island small statesPakistanPalauPanamaPapua New GuineaParaguayPeruPhilippinesPolandPortugalPost-demographic dividendPre-demographic dividendPuerto RicoQatarRomaniaRussian FederationRwandaSamoaSan MarinoSao Tome and PrincipeSaudi ArabiaSenegalSerbiaSeychellesSierra LeoneSingaporeSlovak RepublicSloveniaSmall statesSolomon IslandsSomaliaSouth AfricaSouth AsiaSouth Asia (IDA & IBRD)South SudanSpainSri LankaSt. Kitts and NevisSt. LuciaSt. Vincent and the GrenadinesSub-Saharan Africa Sub-Saharan Africa (excluding high income)Sub-Saharan Africa (IDA & IBRD countries)SudanSurinameSwazilandSwedenSwitzerlandSyrian Arab RepublicTajikistanTanzaniaThailandTimor-LesteTogoTongaTrinidad and TobagoTunisiaTurkeyTurkmenistanTuvaluUgandaUkraineUnited Arab EmiratesUnited KingdomUnited StatesUpper middle incomeUruguayUzbekistanVanuatuVenezuela, RBVietnamVirgin Islands (U.S.)West Bank and GazaWorldYemen, Rep.ZambiaZimbabwe línea de tiempo (timeline):
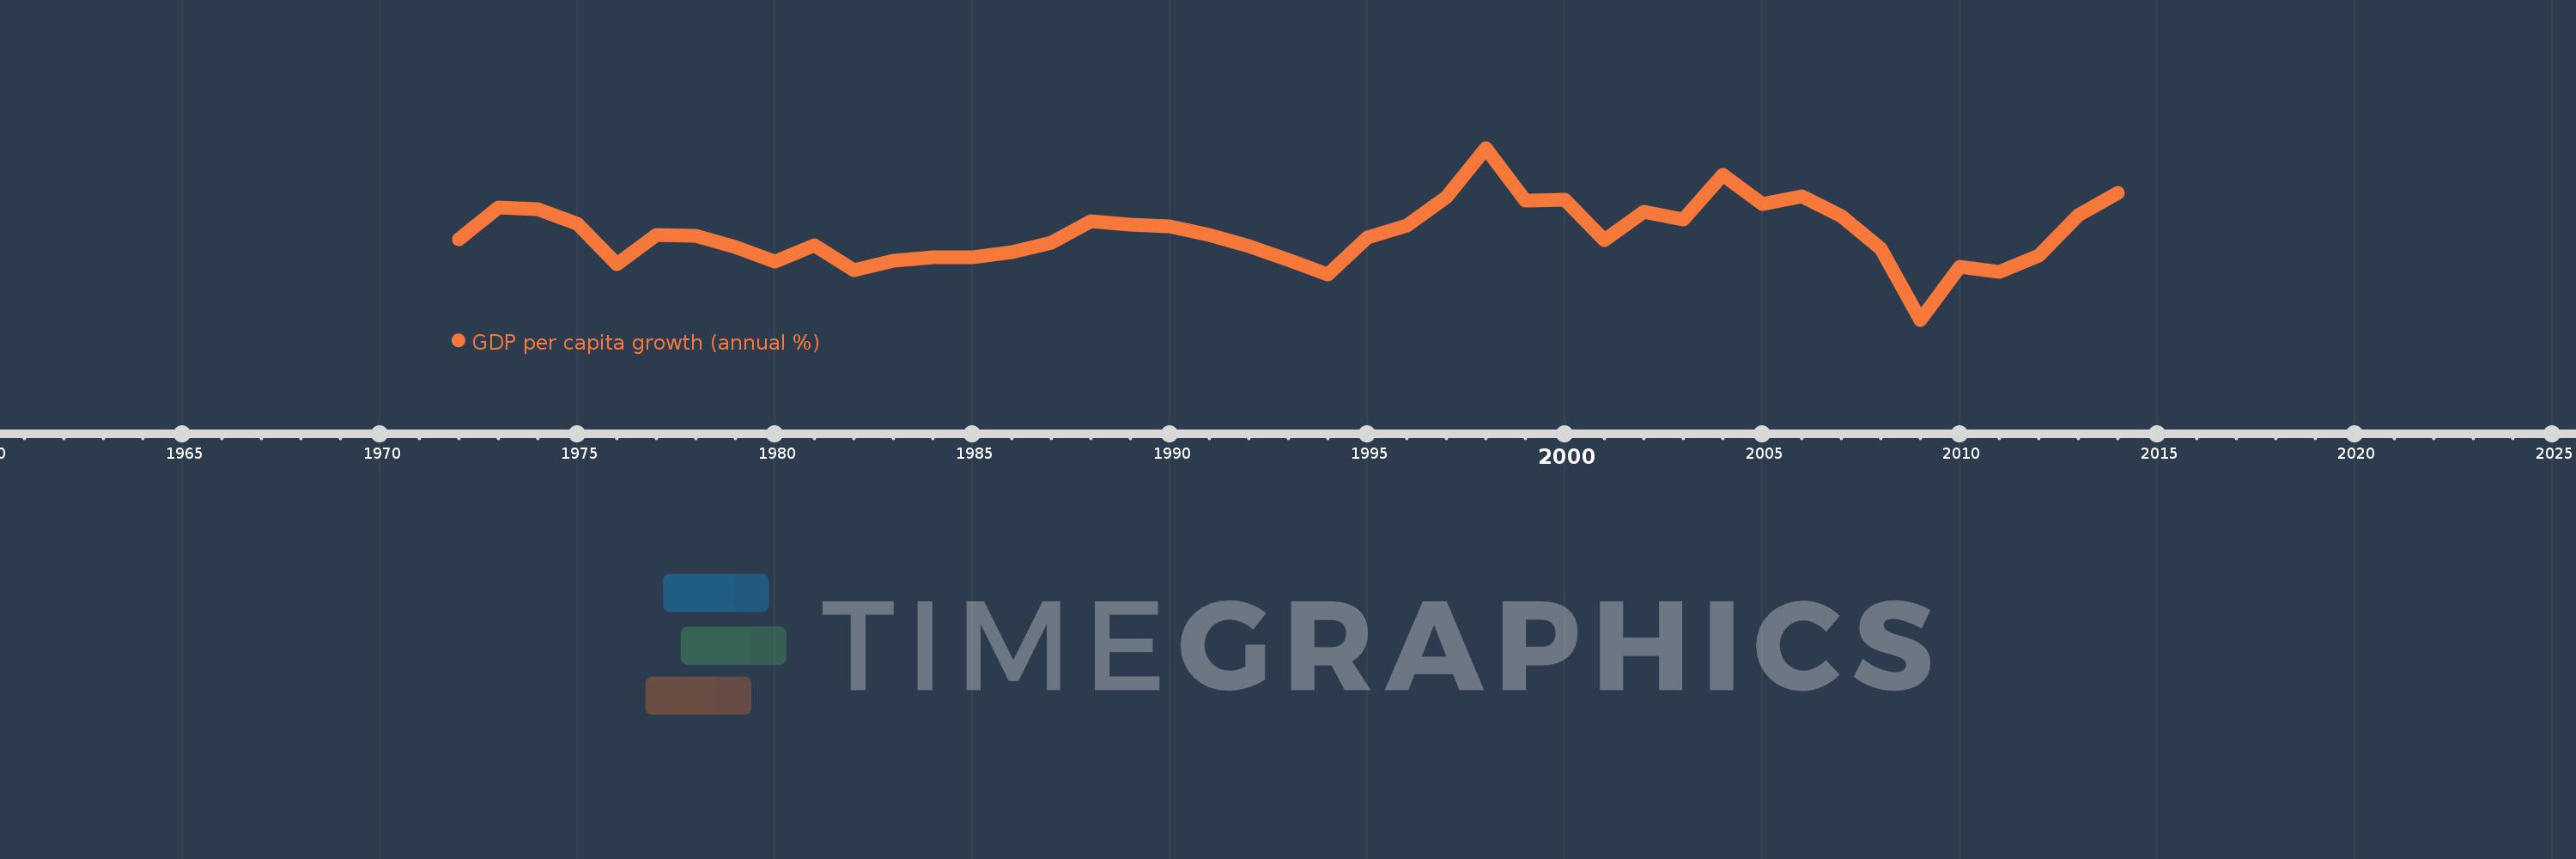
En esta escala de tiempo se presenta un gráfico de 1972 y 2014 de Andorra. Los datos de 1971 están ausentes. El número de observaciones reales por fecha: 43.
Fuente (nombre):
Indicadores del desarrollo mundial
Fuente (organización):
World Bank national accounts data, and OECD National Accounts data files.
Categorías:
Economy & Growth
Se ha actualizado:
23 abr 2017 año
Los indicadores de los cambios de valor en los últimos años
Mínimo:
-9.382
1 ene 2009 año
Máximo:
9.313
1 ene 1998 año
A la fecha de observación
Valor
Cambio absoluto
El cambio con respecto al valor anterior
1 ene 1972 año
-0.595
-0.595
0.0%
1 ene 1973 año
2.793
+3.388
-569.17%
1 ene 1974 año
2.676
-0.117
-4.18%
1 ene 1975 año
1.027
-1.649
-61.61%
1 ene 1976 año
-3.361
-4.388
-427.1%
1 ene 1977 año
-0.19
+3.17
-94.33%
1 ene 1978 año
-0.262
-0.072
37.57%
1 ene 1979 año
-1.475
-1.212
462.68%
1 ene 1980 año
-3.041
-1.567
106.26%
1 ene 1981 año
-1.317
+1.724
-56.7%
1 ene 1982 año
-3.965
-2.648
201.03%
1 ene 1983 año
-2.921
+1.043
-26.32%
1 ene 1984 año
-2.588
+0.333
-11.39%
1 ene 1985 año
-2.606
-0.017
0.67%
1 ene 1986 año
-2.022
+0.584
-22.41%
1 ene 1987 año
-1.004
+1.018
-50.33%
1 ene 1988 año
1.315
+2.319
-230.95%
1 ene 1989 año
0.983
-0.332
-25.27%
1 ene 1990 año
0.794
-0.189
-19.23%
1 ene 1991 año
-0.144
-0.938
-118.19%
1 ene 1992 año
-1.368
-1.223
847.35%
1 ene 1993 año
-2.892
-1.524
111.43%
1 ene 1994 año
-4.437
-1.545
53.43%
1 ene 1995 año
-0.399
+4.038
-91.01%
1 ene 1996 año
0.912
+1.311
-328.51%
1 ene 1997 año
3.938
+3.027
331.99%
1 ene 1998 año
9.313
+5.374
136.45%
1 ene 1999 año
3.613
-5.699
-61.2%
1 ene 2000 año
3.656
+0.043
1.19%
1 ene 2001 año
-0.749
-4.405
-120.49%
1 ene 2002 año
2.356
+3.105
-414.43%
1 ene 2003 año
1.519
-0.837
-35.51%
1 ene 2004 año
6.426
+4.907
322.93%
1 ene 2005 año
3.167
-3.259
-50.72%
1 ene 2006 año
4.008
+0.841
26.57%
1 ene 2007 año
1.888
-2.12
-52.89%
1 ene 2008 año
-1.696
-3.585
-189.84%
1 ene 2009 año
-9.382
-7.686
453.04%
1 ene 2010 año
-3.658
+5.724
-61.01%
1 ene 2011 año
-4.165
-0.507
13.86%
1 ene 2012 año
-2.382
+1.783
-42.8%
1 ene 2013 año
1.968
+4.351
-182.61%
1 ene 2014 año
4.432
+2.463
125.16%
Ranking de los países por los datos estadísticos actuales


Comentarios: