29
/es/
es
AIzaSyAYiBZKx7MnpbEhh9jyipgxe19OcubqV5w
April 1, 2024
103609
Chad
TCD
true
2
1
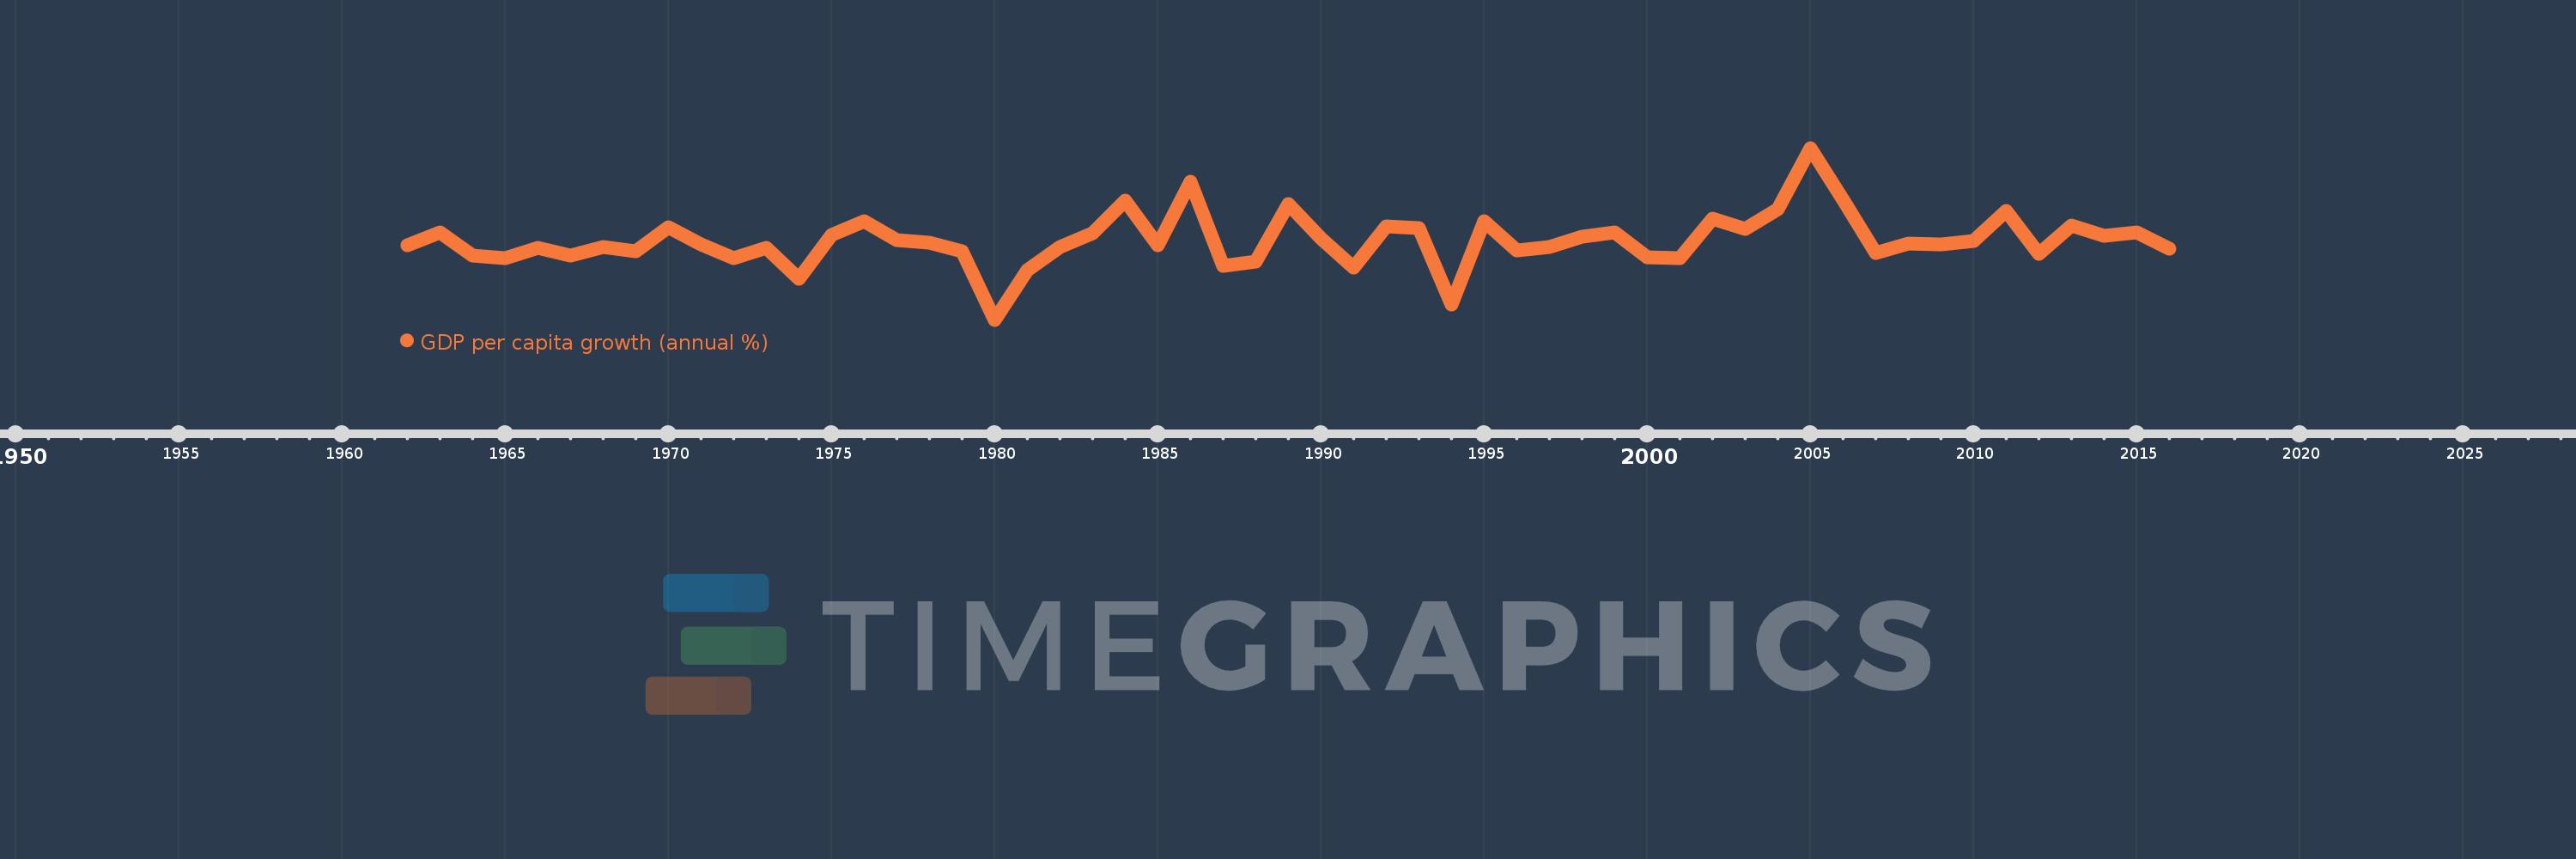
GDP per capita growth (annual %)
2016,2015,2014,2013,2012,2011,2010,2009,2008,2007,2006,2005,2004,2003,2002,2001,2000,1999,1998,1997,1996,1995,1994,1993,1992,1991,1990,1989,1988,1987,1986,1985,1984,1983,1982,1981,1980,1979,1978,1977,1976,1975,1974,1973,1972,1971,1970,1969,1968,1967,1966,1965,1964,1963,1962
Estas estadísticas en otros países:
AfghanistanAlbaniaAlgeriaAndorraAngolaAntigua and BarbudaArab WorldArgentinaArmeniaArubaAustraliaAustriaAzerbaijanBahamas, TheBahrainBangladeshBarbadosBelarusBelgiumBelizeBeninBermudaBhutanBoliviaBosnia and HerzegovinaBotswanaBrazilBrunei DarussalamBulgariaBurkina FasoBurundiCabo VerdeCambodiaCameroonCanadaCaribbean small statesCayman IslandsCentral African RepublicCentral Europe and the BalticsChadChannel IslandsChileChinaColombiaComorosCongo, Dem. Rep.Congo, Rep.Costa RicaCote d'IvoireCroatiaCubaCyprusCzech RepublicDenmarkDjiboutiDominicaDominican RepublicEarly-demographic dividendEast Asia & PacificEast Asia & Pacific (excluding high income)East Asia & Pacific (IDA & IBRD countries)EcuadorEgypt, Arab Rep.El SalvadorEquatorial GuineaEritreaEstoniaEthiopiaEuro areaEurope & Central AsiaEurope & Central Asia (excluding high income)Europe & Central Asia (IDA & IBRD countries)European UnionFijiFinlandFragile and conflict affected situationsFranceFrench PolynesiaGabonGambia, TheGeorgiaGermanyGhanaGreeceGreenlandGrenadaGuatemalaGuineaGuinea-BissauGuyanaHaitiHeavily indebted poor countries (HIPC)High incomeHondurasHong Kong SAR, ChinaHungaryIBRD onlyIcelandIDA & IBRD totalIDA blendIDA onlyIDA totalIndiaIndonesiaIran, Islamic Rep.IraqIrelandIsle of ManIsraelItalyJamaicaJapanJordanKazakhstanKenyaKiribatiKorea, Rep.KosovoKuwaitKyrgyz RepublicLao PDRLate-demographic dividendLatin America & Caribbean Latin America & Caribbean (excluding high income)Latin America & the Caribbean (IDA & IBRD countries)LatviaLeast developed countries: UN classificationLebanonLesothoLiberiaLibyaLiechtensteinLithuaniaLow & middle incomeLow incomeLower middle incomeLuxembourgMacao SAR, ChinaMacedonia, FYRMadagascarMalawiMalaysiaMaldivesMaliMaltaMarshall IslandsMauritaniaMauritiusMexicoMicronesia, Fed. Sts.Middle East & North AfricaMiddle East & North Africa (excluding high income)Middle East & North Africa (IDA & IBRD countries)Middle incomeMoldovaMonacoMongoliaMontenegroMoroccoMozambiqueMyanmarNamibiaNauruNepalNetherlandsNew CaledoniaNew ZealandNicaraguaNigerNigeriaNorth AmericaNorwayOECD membersOmanOther small statesPacific island small statesPakistanPalauPanamaPapua New GuineaParaguayPeruPhilippinesPolandPortugalPost-demographic dividendPre-demographic dividendPuerto RicoQatarRomaniaRussian FederationRwandaSamoaSan MarinoSao Tome and PrincipeSaudi ArabiaSenegalSerbiaSeychellesSierra LeoneSingaporeSlovak RepublicSloveniaSmall statesSolomon IslandsSomaliaSouth AfricaSouth AsiaSouth Asia (IDA & IBRD)South SudanSpainSri LankaSt. Kitts and NevisSt. LuciaSt. Vincent and the GrenadinesSub-Saharan Africa Sub-Saharan Africa (excluding high income)Sub-Saharan Africa (IDA & IBRD countries)SudanSurinameSwazilandSwedenSwitzerlandSyrian Arab RepublicTajikistanTanzaniaThailandTimor-LesteTogoTongaTrinidad and TobagoTunisiaTurkeyTurkmenistanTuvaluUgandaUkraineUnited Arab EmiratesUnited KingdomUnited StatesUpper middle incomeUruguayUzbekistanVanuatuVenezuela, RBVietnamVirgin Islands (U.S.)West Bank and GazaWorldYemen, Rep.ZambiaZimbabwe línea de tiempo (timeline):
En esta escala de tiempo se presenta un gráfico de 1962 y 2016 de Chad. Los datos de 1961 están ausentes. El número de observaciones reales por fecha: 55.
Fuente (nombre):
Indicadores del desarrollo mundial
Fuente (organización):
World Bank national accounts data, and OECD National Accounts data files.
Categorías:
Economy & Growth
Se ha actualizado:
23 abr 2017 año
Los indicadores de los cambios de valor en los últimos años
Mínimo:
-22.952
1 ene 1980 año
Máximo:
28.717
1 ene 2005 año
A la fecha de observación
Valor
Cambio absoluto
El cambio con respecto al valor anterior
1 ene 1962 año
-0.551
-0.551
0.0%
1 ene 1963 año
3.304
+3.855
-699.99%
1 ene 1964 año
-3.528
-6.832
-206.78%
1 ene 1965 año
-4.403
-0.875
24.79%
1 ene 1966 año
-1.312
+3.091
-70.2%
1 ene 1967 año
-3.63
-2.319
176.74%
1 ene 1968 año
-1.07
+2.56
-70.52%
1 ene 1969 año
-2.293
-1.222
114.19%
1 ene 1970 año
4.815
+7.108
-310.03%
1 ene 1971 año
-0.24
-5.055
-104.98%
1 ene 1972 año
-4.41
-4.17
1.74 mil%
1 ene 1973 año
-1.207
+3.203
-72.63%
1 ene 1974 año
-10.547
-9.34
773.78%
1 ene 1975 año
2.554
+13.101
-124.21%
1 ene 1976 año
6.655
+4.101
160.59%
1 ene 1977 año
0.903
-5.752
-86.44%
1 ene 1978 año
0.272
-0.631
-69.92%
1 ene 1979 año
-2.343
-2.615
-962.92%
1 ene 1980 año
-22.952
-20.609
879.62%
1 ene 1981 año
-7.949
+15.003
-65.37%
1 ene 1982 año
-1.108
+6.841
-86.06%
1 ene 1983 año
2.999
+4.107
-370.56%
1 ene 1984 año
12.949
+9.95
331.82%
1 ene 1985 año
-0.526
-13.475
-104.06%
1 ene 1986 año
18.503
+19.029
-3.62 mil%
1 ene 1987 año
-6.853
-25.356
-137.04%
1 ene 1988 año
-5.368
+1.484
-21.66%
1 ene 1989 año
11.838
+17.207
-320.52%
1 ene 1990 año
1.544
-10.294
-86.96%
1 ene 1991 año
-7.214
-8.758
-567.15%
1 ene 1992 año
5.126
+12.34
-171.06%
1 ene 1993 año
4.618
-0.509
-9.92%
1 ene 1994 año
-18.364
-22.982
-497.7%
1 ene 1995 año
6.617
+24.981
-136.03%
1 ene 1996 año
-2.068
-8.685
-131.25%
1 ene 1997 año
-1.178
+0.889
-43.01%
1 ene 1998 año
2.099
+3.277
-278.13%
1 ene 1999 año
3.285
+1.186
56.53%
1 ene 2000 año
-4.172
-7.457
-226.99%
1 ene 2001 año
-4.451
-0.279
6.69%
1 ene 2002 año
7.53
+11.981
-269.18%
1 ene 2003 año
4.412
-3.119
-41.41%
1 ene 2004 año
10.412
+6.0
136.0%
1 ene 2005 año
28.717
+18.305
175.82%
1 ene 2006 año
13.167
-15.55
-54.15%
1 ene 2007 año
-2.786
-15.953
-121.16%
1 ene 2008 año
-0.138
+2.648
-95.05%
1 ene 2009 año
-0.28
-0.142
102.72%
1 ene 2010 año
0.86
+1.14
-407.51%
1 ene 2011 año
9.867
+9.007
1.05 mil%
1 ene 2012 año
-3.19
-13.057
-132.33%
1 ene 2013 año
5.312
+8.502
-266.55%
1 ene 2014 año
2.24
-3.072
-57.83%
1 ene 2015 año
3.428
+1.188
53.05%
1 ene 2016 año
-1.466
-4.895
-142.78%
Ranking de los países por los datos estadísticos actuales


Comentarios: