29
/es/
es
AIzaSyAYiBZKx7MnpbEhh9jyipgxe19OcubqV5w
April 1, 2024
276645
United States
USA
true
2
1
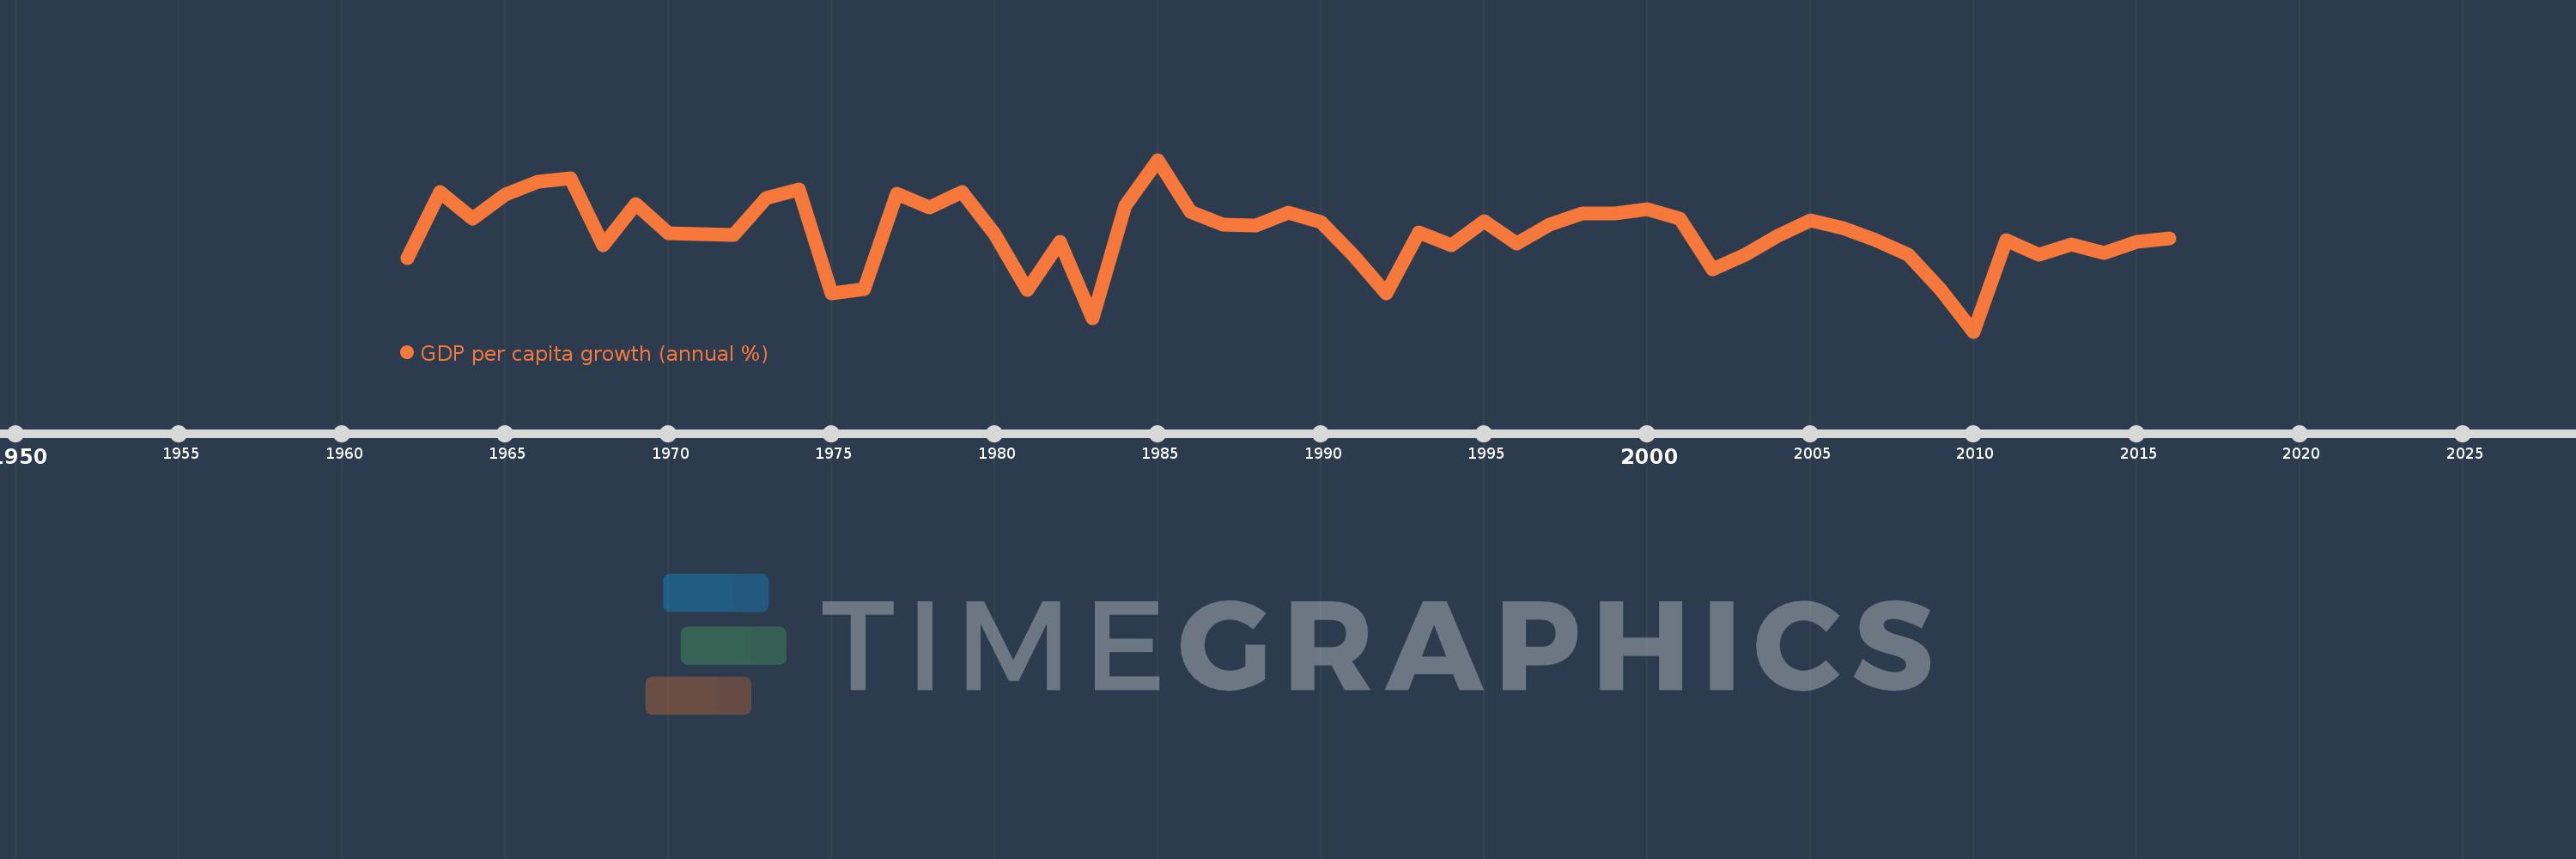
GDP per capita growth (annual %)
2016,2015,2014,2013,2012,2011,2010,2009,2008,2007,2006,2005,2004,2003,2002,2001,2000,1999,1998,1997,1996,1995,1994,1993,1992,1991,1990,1989,1988,1987,1986,1985,1984,1983,1982,1981,1980,1979,1978,1977,1976,1975,1974,1973,1972,1971,1970,1969,1968,1967,1966,1965,1964,1963,1962
Estas estadísticas en otros países:
AfghanistanAlbaniaAlgeriaAndorraAngolaAntigua and BarbudaArab WorldArgentinaArmeniaArubaAustraliaAustriaAzerbaijanBahamas, TheBahrainBangladeshBarbadosBelarusBelgiumBelizeBeninBermudaBhutanBoliviaBosnia and HerzegovinaBotswanaBrazilBrunei DarussalamBulgariaBurkina FasoBurundiCabo VerdeCambodiaCameroonCanadaCaribbean small statesCayman IslandsCentral African RepublicCentral Europe and the BalticsChadChannel IslandsChileChinaColombiaComorosCongo, Dem. Rep.Congo, Rep.Costa RicaCote d'IvoireCroatiaCubaCyprusCzech RepublicDenmarkDjiboutiDominicaDominican RepublicEarly-demographic dividendEast Asia & PacificEast Asia & Pacific (excluding high income)East Asia & Pacific (IDA & IBRD countries)EcuadorEgypt, Arab Rep.El SalvadorEquatorial GuineaEritreaEstoniaEthiopiaEuro areaEurope & Central AsiaEurope & Central Asia (excluding high income)Europe & Central Asia (IDA & IBRD countries)European UnionFijiFinlandFragile and conflict affected situationsFranceFrench PolynesiaGabonGambia, TheGeorgiaGermanyGhanaGreeceGreenlandGrenadaGuatemalaGuineaGuinea-BissauGuyanaHaitiHeavily indebted poor countries (HIPC)High incomeHondurasHong Kong SAR, ChinaHungaryIBRD onlyIcelandIDA & IBRD totalIDA blendIDA onlyIDA totalIndiaIndonesiaIran, Islamic Rep.IraqIrelandIsle of ManIsraelItalyJamaicaJapanJordanKazakhstanKenyaKiribatiKorea, Rep.KosovoKuwaitKyrgyz RepublicLao PDRLate-demographic dividendLatin America & Caribbean Latin America & Caribbean (excluding high income)Latin America & the Caribbean (IDA & IBRD countries)LatviaLeast developed countries: UN classificationLebanonLesothoLiberiaLibyaLiechtensteinLithuaniaLow & middle incomeLow incomeLower middle incomeLuxembourgMacao SAR, ChinaMacedonia, FYRMadagascarMalawiMalaysiaMaldivesMaliMaltaMarshall IslandsMauritaniaMauritiusMexicoMicronesia, Fed. Sts.Middle East & North AfricaMiddle East & North Africa (excluding high income)Middle East & North Africa (IDA & IBRD countries)Middle incomeMoldovaMonacoMongoliaMontenegroMoroccoMozambiqueMyanmarNamibiaNauruNepalNetherlandsNew CaledoniaNew ZealandNicaraguaNigerNigeriaNorth AmericaNorwayOECD membersOmanOther small statesPacific island small statesPakistanPalauPanamaPapua New GuineaParaguayPeruPhilippinesPolandPortugalPost-demographic dividendPre-demographic dividendPuerto RicoQatarRomaniaRussian FederationRwandaSamoaSan MarinoSao Tome and PrincipeSaudi ArabiaSenegalSerbiaSeychellesSierra LeoneSingaporeSlovak RepublicSloveniaSmall statesSolomon IslandsSomaliaSouth AfricaSouth AsiaSouth Asia (IDA & IBRD)South SudanSpainSri LankaSt. Kitts and NevisSt. LuciaSt. Vincent and the GrenadinesSub-Saharan Africa Sub-Saharan Africa (excluding high income)Sub-Saharan Africa (IDA & IBRD countries)SudanSurinameSwazilandSwedenSwitzerlandSyrian Arab RepublicTajikistanTanzaniaThailandTimor-LesteTogoTongaTrinidad and TobagoTunisiaTurkeyTurkmenistanTuvaluUgandaUkraineUnited Arab EmiratesUnited KingdomUnited StatesUpper middle incomeUruguayUzbekistanVanuatuVenezuela, RBVietnamVirgin Islands (U.S.)West Bank and GazaWorldYemen, Rep.ZambiaZimbabwe línea de tiempo (timeline):
En esta escala de tiempo se presenta un gráfico de 1962 y 2016 de United States. Los datos de 1961 están ausentes. El número de observaciones reales por fecha: 55.
Fuente (nombre):
Indicadores del desarrollo mundial
Fuente (organización):
World Bank national accounts data, and OECD National Accounts data files.
Categorías:
Economy & Growth
Se ha actualizado:
23 abr 2017 año
Los indicadores de los cambios de valor en los últimos años
Mínimo:
-3.624
1 ene 2010 año
Máximo:
6.334
1 ene 1985 año
A la fecha de observación
Valor
Cambio absoluto
El cambio con respecto al valor anterior
1 ene 1962 año
0.618
+0.618
0.0%
1 ene 1963 año
4.481
+3.863
624.89%
1 ene 1964 año
2.908
-1.572
-35.09%
1 ene 1965 año
4.341
+1.432
49.25%
1 ene 1966 año
5.078
+0.738
16.99%
1 ene 1967 año
5.277
+0.199
3.92%
1 ene 1968 año
1.39
-3.887
-73.66%
1 ene 1969 año
3.759
+2.369
170.43%
1 ene 1970 año
2.097
-1.661
-44.2%
1 ene 1971 año
2.011
-0.086
-4.1%
1 ene 1972 año
1.998
-0.014
-0.68%
1 ene 1973 año
4.142
+2.145
107.36%
1 ene 1974 año
4.64
+0.497
12.0%
1 ene 1975 año
-1.422
-6.062
-130.65%
1 ene 1976 año
-1.177
+0.245
-17.23%
1 ene 1977 año
4.389
+5.566
-472.97%
1 ene 1978 año
3.562
-0.828
-18.86%
1 ene 1979 año
4.449
+0.887
24.91%
1 ene 1980 año
2.043
-2.406
-54.07%
1 ene 1981 año
-1.197
-3.241
-158.59%
1 ene 1982 año
1.593
+2.79
-233.01%
1 ene 1983 año
-2.842
-4.434
-278.43%
1 ene 1984 año
3.68
+6.522
-229.51%
1 ene 1985 año
6.334
+2.654
72.13%
1 ene 1986 año
3.319
-3.015
-47.6%
1 ene 1987 año
2.559
-0.76
-22.89%
1 ene 1988 año
2.541
-0.018
-0.72%
1 ene 1989 año
3.262
+0.721
28.37%
1 ene 1990 año
2.706
-0.556
-17.05%
1 ene 1991 año
0.775
-1.931
-71.38%
1 ene 1992 año
-1.4
-2.175
-280.82%
1 ene 1993 año
2.129
+3.53
-252.03%
1 ene 1994 año
1.4
-0.729
-34.25%
1 ene 1995 año
2.77
+1.37
97.85%
1 ene 1996 año
1.503
-1.267
-45.73%
1 ene 1997 año
2.595
+1.092
72.67%
1 ene 1998 año
3.237
+0.641
24.71%
1 ene 1999 año
3.239
+0.003
0.09%
1 ene 2000 año
3.49
+0.251
7.73%
1 ene 2001 año
2.94
-0.55
-15.75%
1 ene 2002 año
-0.018
-2.959
-100.63%
1 ene 2003 año
0.846
+0.865
-4.68 mil%
1 ene 2004 año
1.927
+1.081
127.74%
1 ene 2005 año
2.83
+0.903
46.85%
1 ene 2006 año
2.397
-0.433
-15.29%
1 ene 2007 año
1.681
-0.716
-29.85%
1 ene 2008 año
0.815
-0.866
-51.52%
1 ene 2009 año
-1.23
-2.045
-250.92%
1 ene 2010 año
-3.624
-2.394
194.58%
1 ene 2011 año
1.678
+5.302
-146.31%
1 ene 2012 año
0.828
-0.85
-50.65%
1 ene 2013 año
1.448
+0.62
74.84%
1 ene 2014 año
0.93
-0.518
-35.76%
1 ene 2015 año
1.574
+0.644
69.23%
1 ene 2016 año
1.795
+0.22
13.98%
Ranking de los países por los datos estadísticos actuales


Comentarios: