29
/es/
es
AIzaSyAYiBZKx7MnpbEhh9jyipgxe19OcubqV5w
April 1, 2024
82782
Belize
BLZ
true
2
1
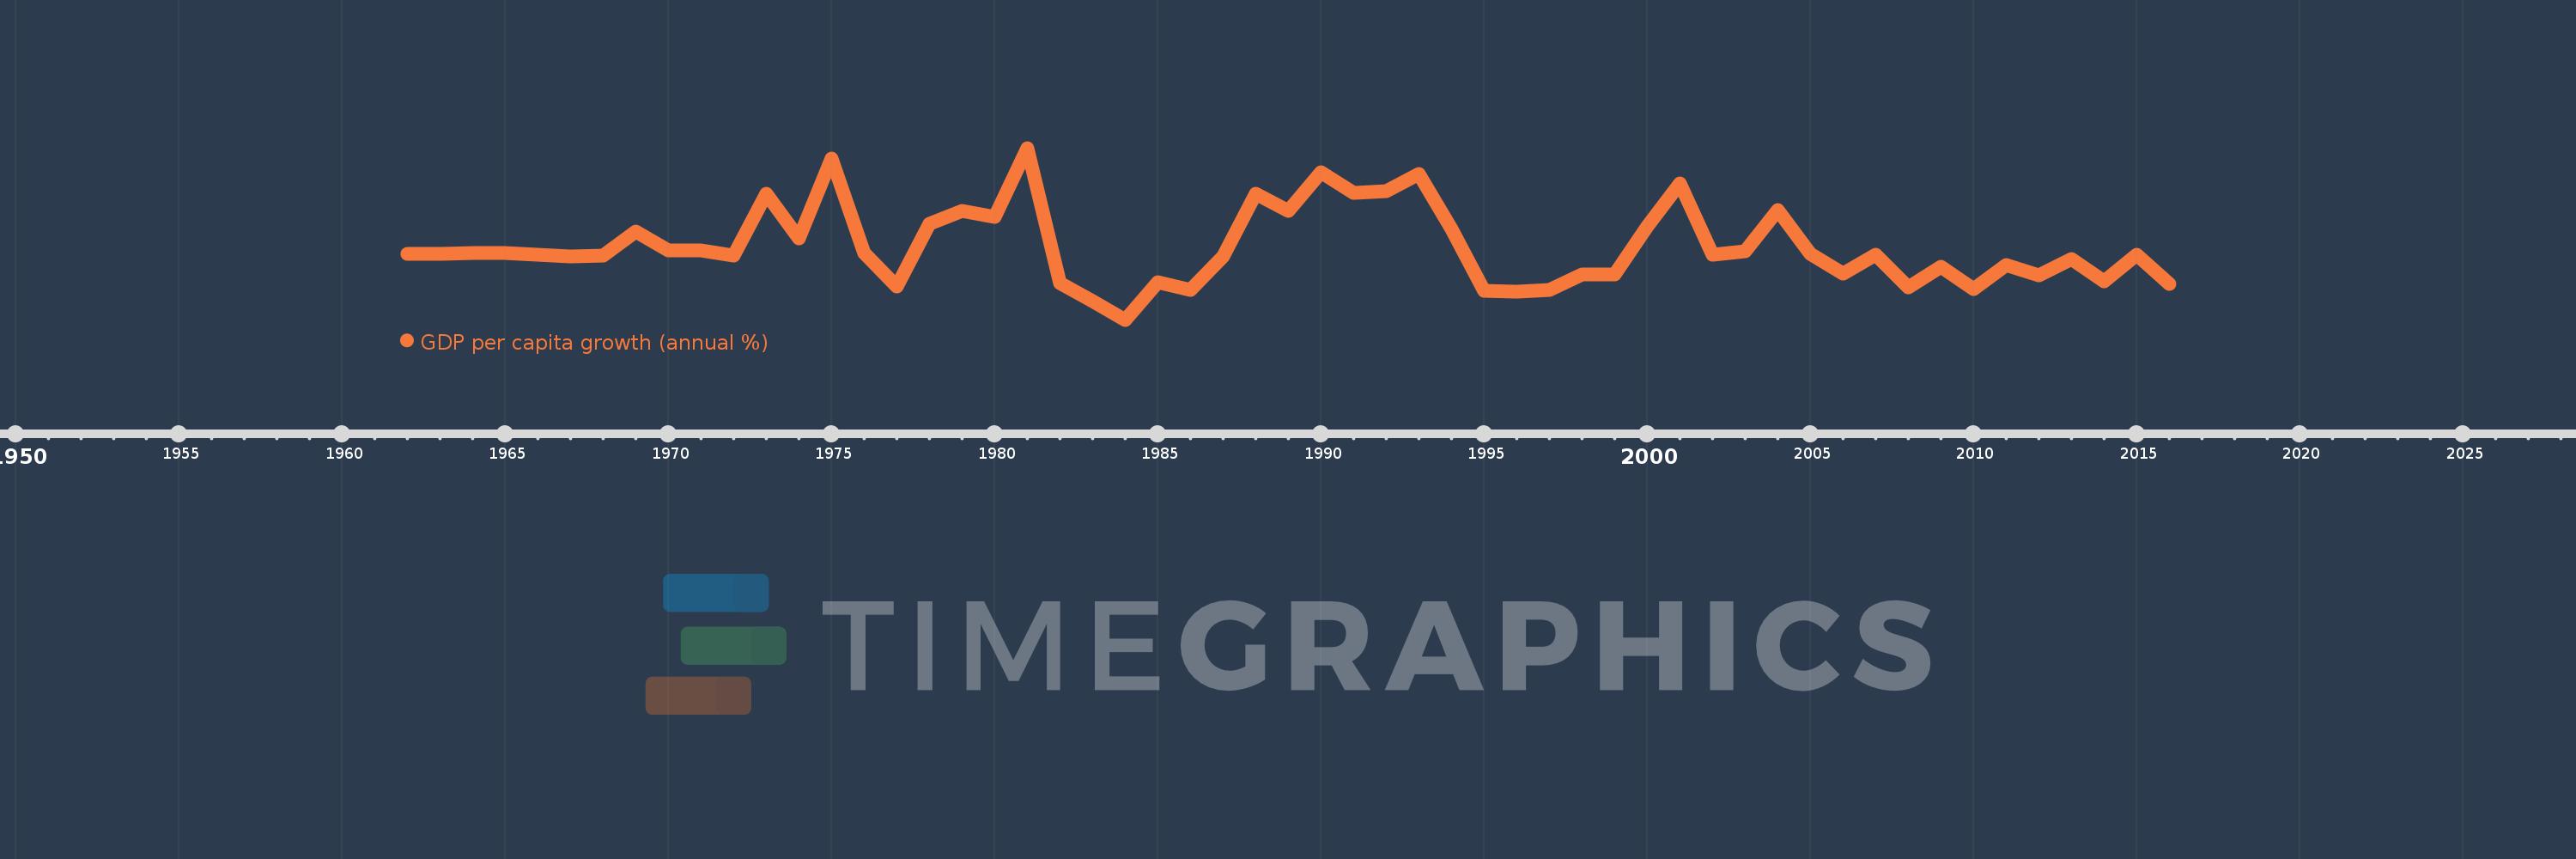
GDP per capita growth (annual %)
2016,2015,2014,2013,2012,2011,2010,2009,2008,2007,2006,2005,2004,2003,2002,2001,2000,1999,1998,1997,1996,1995,1994,1993,1992,1991,1990,1989,1988,1987,1986,1985,1984,1983,1982,1981,1980,1979,1978,1977,1976,1975,1974,1973,1972,1971,1970,1969,1968,1967,1966,1965,1964,1963,1962
Estas estadísticas en otros países:
AfghanistanAlbaniaAlgeriaAndorraAngolaAntigua and BarbudaArab WorldArgentinaArmeniaArubaAustraliaAustriaAzerbaijanBahamas, TheBahrainBangladeshBarbadosBelarusBelgiumBelizeBeninBermudaBhutanBoliviaBosnia and HerzegovinaBotswanaBrazilBrunei DarussalamBulgariaBurkina FasoBurundiCabo VerdeCambodiaCameroonCanadaCaribbean small statesCayman IslandsCentral African RepublicCentral Europe and the BalticsChadChannel IslandsChileChinaColombiaComorosCongo, Dem. Rep.Congo, Rep.Costa RicaCote d'IvoireCroatiaCubaCyprusCzech RepublicDenmarkDjiboutiDominicaDominican RepublicEarly-demographic dividendEast Asia & PacificEast Asia & Pacific (excluding high income)East Asia & Pacific (IDA & IBRD countries)EcuadorEgypt, Arab Rep.El SalvadorEquatorial GuineaEritreaEstoniaEthiopiaEuro areaEurope & Central AsiaEurope & Central Asia (excluding high income)Europe & Central Asia (IDA & IBRD countries)European UnionFijiFinlandFragile and conflict affected situationsFranceFrench PolynesiaGabonGambia, TheGeorgiaGermanyGhanaGreeceGreenlandGrenadaGuatemalaGuineaGuinea-BissauGuyanaHaitiHeavily indebted poor countries (HIPC)High incomeHondurasHong Kong SAR, ChinaHungaryIBRD onlyIcelandIDA & IBRD totalIDA blendIDA onlyIDA totalIndiaIndonesiaIran, Islamic Rep.IraqIrelandIsle of ManIsraelItalyJamaicaJapanJordanKazakhstanKenyaKiribatiKorea, Rep.KosovoKuwaitKyrgyz RepublicLao PDRLate-demographic dividendLatin America & Caribbean Latin America & Caribbean (excluding high income)Latin America & the Caribbean (IDA & IBRD countries)LatviaLeast developed countries: UN classificationLebanonLesothoLiberiaLibyaLiechtensteinLithuaniaLow & middle incomeLow incomeLower middle incomeLuxembourgMacao SAR, ChinaMacedonia, FYRMadagascarMalawiMalaysiaMaldivesMaliMaltaMarshall IslandsMauritaniaMauritiusMexicoMicronesia, Fed. Sts.Middle East & North AfricaMiddle East & North Africa (excluding high income)Middle East & North Africa (IDA & IBRD countries)Middle incomeMoldovaMonacoMongoliaMontenegroMoroccoMozambiqueMyanmarNamibiaNauruNepalNetherlandsNew CaledoniaNew ZealandNicaraguaNigerNigeriaNorth AmericaNorwayOECD membersOmanOther small statesPacific island small statesPakistanPalauPanamaPapua New GuineaParaguayPeruPhilippinesPolandPortugalPost-demographic dividendPre-demographic dividendPuerto RicoQatarRomaniaRussian FederationRwandaSamoaSan MarinoSao Tome and PrincipeSaudi ArabiaSenegalSerbiaSeychellesSierra LeoneSingaporeSlovak RepublicSloveniaSmall statesSolomon IslandsSomaliaSouth AfricaSouth AsiaSouth Asia (IDA & IBRD)South SudanSpainSri LankaSt. Kitts and NevisSt. LuciaSt. Vincent and the GrenadinesSub-Saharan Africa Sub-Saharan Africa (excluding high income)Sub-Saharan Africa (IDA & IBRD countries)SudanSurinameSwazilandSwedenSwitzerlandSyrian Arab RepublicTajikistanTanzaniaThailandTimor-LesteTogoTongaTrinidad and TobagoTunisiaTurkeyTurkmenistanTuvaluUgandaUkraineUnited Arab EmiratesUnited KingdomUnited StatesUpper middle incomeUruguayUzbekistanVanuatuVenezuela, RBVietnamVirgin Islands (U.S.)West Bank and GazaWorldYemen, Rep.ZambiaZimbabwe línea de tiempo (timeline):
En esta escala de tiempo se presenta un gráfico de 1962 y 2016 de Belize. Los datos de 1961 están ausentes. El número de observaciones reales por fecha: 55.
Fuente (nombre):
Indicadores del desarrollo mundial
Fuente (organización):
World Bank national accounts data, and OECD National Accounts data files.
Categorías:
Economy & Growth
Se ha actualizado:
23 abr 2017 año
Los indicadores de los cambios de valor en los últimos años
Mínimo:
-4.821
1 ene 1984 año
Máximo:
12.895
1 ene 1981 año
A la fecha de observación
Valor
Cambio absoluto
El cambio con respecto al valor anterior
1 ene 1962 año
1.976
+1.976
0.0%
1 ene 1963 año
1.998
+0.022
1.09%
1 ene 1964 año
2.047
+0.049
2.46%
1 ene 1965 año
2.042
-0.005
-0.25%
1 ene 1966 año
1.914
-0.128
-6.26%
1 ene 1967 año
1.683
-0.231
-12.08%
1 ene 1968 año
1.79
+0.107
6.37%
1 ene 1969 año
4.257
+2.467
137.84%
1 ene 1970 año
2.287
-1.97
-46.28%
1 ene 1971 año
2.304
+0.017
0.73%
1 ene 1972 año
1.783
-0.521
-22.62%
1 ene 1973 año
8.176
+6.393
358.64%
1 ene 1974 año
3.603
-4.573
-55.93%
1 ene 1975 año
11.82
+8.217
228.03%
1 ene 1976 año
2.073
-9.747
-82.46%
1 ene 1977 año
-1.428
-3.501
-168.86%
1 ene 1978 año
5.062
+6.489
-454.55%
1 ene 1979 año
6.382
+1.321
26.1%
1 ene 1980 año
5.74
-0.643
-10.07%
1 ene 1981 año
12.895
+7.156
124.67%
1 ene 1982 año
-1.053
-13.949
-108.17%
1 ene 1983 año
-2.871
-1.818
172.55%
1 ene 1984 año
-4.821
-1.95
67.92%
1 ene 1985 año
-0.917
+3.904
-80.97%
1 ene 1986 año
-1.736
-0.819
89.24%
1 ene 1987 año
1.704
+3.44
-198.15%
1 ene 1988 año
8.182
+6.477
380.1%
1 ene 1989 año
6.37
-1.811
-22.14%
1 ene 1990 año
10.351
+3.981
62.49%
1 ene 1991 año
8.221
-2.13
-20.58%
1 ene 1992 año
8.43
+0.209
2.55%
1 ene 1993 año
10.194
+1.764
20.93%
1 ene 1994 año
4.505
-5.689
-55.81%
1 ene 1995 año
-1.86
-6.365
-141.28%
1 ene 1996 año
-1.926
-0.066
3.54%
1 ene 1997 año
-1.757
+0.168
-8.74%
1 ene 1998 año
-0.162
+1.595
-90.79%
1 ene 1999 año
-0.17
-0.008
4.78%
1 ene 2000 año
4.805
+4.975
-2.93 mil%
1 ene 2001 año
9.251
+4.446
92.52%
1 ene 2002 año
1.854
-7.397
-79.96%
1 ene 2003 año
2.227
+0.373
20.11%
1 ene 2004 año
6.511
+4.285
192.41%
1 ene 2005 año
2.015
-4.497
-69.06%
1 ene 2006 año
-0.026
-2.041
-101.3%
1 ene 2007 año
1.895
+1.921
-7.31 mil%
1 ene 2008 año
-1.488
-3.383
-178.54%
1 ene 2009 año
0.611
+2.1
-141.08%
1 ene 2010 año
-1.693
-2.304
-376.87%
1 ene 2011 año
0.853
+2.546
-150.41%
1 ene 2012 año
-0.251
-1.104
-129.41%
1 ene 2013 año
1.425
+1.676
-667.96%
1 ene 2014 año
-0.89
-2.315
-162.44%
1 ene 2015 año
1.86
+2.75
-309.01%
1 ene 2016 año
-1.088
-2.948
-158.5%
Ranking de los países por los datos estadísticos actuales


Comentarios: