29
/es/
es
AIzaSyAYiBZKx7MnpbEhh9jyipgxe19OcubqV5w
April 1, 2024
258336
Syrian Arab Republic
SYR
true
2
1
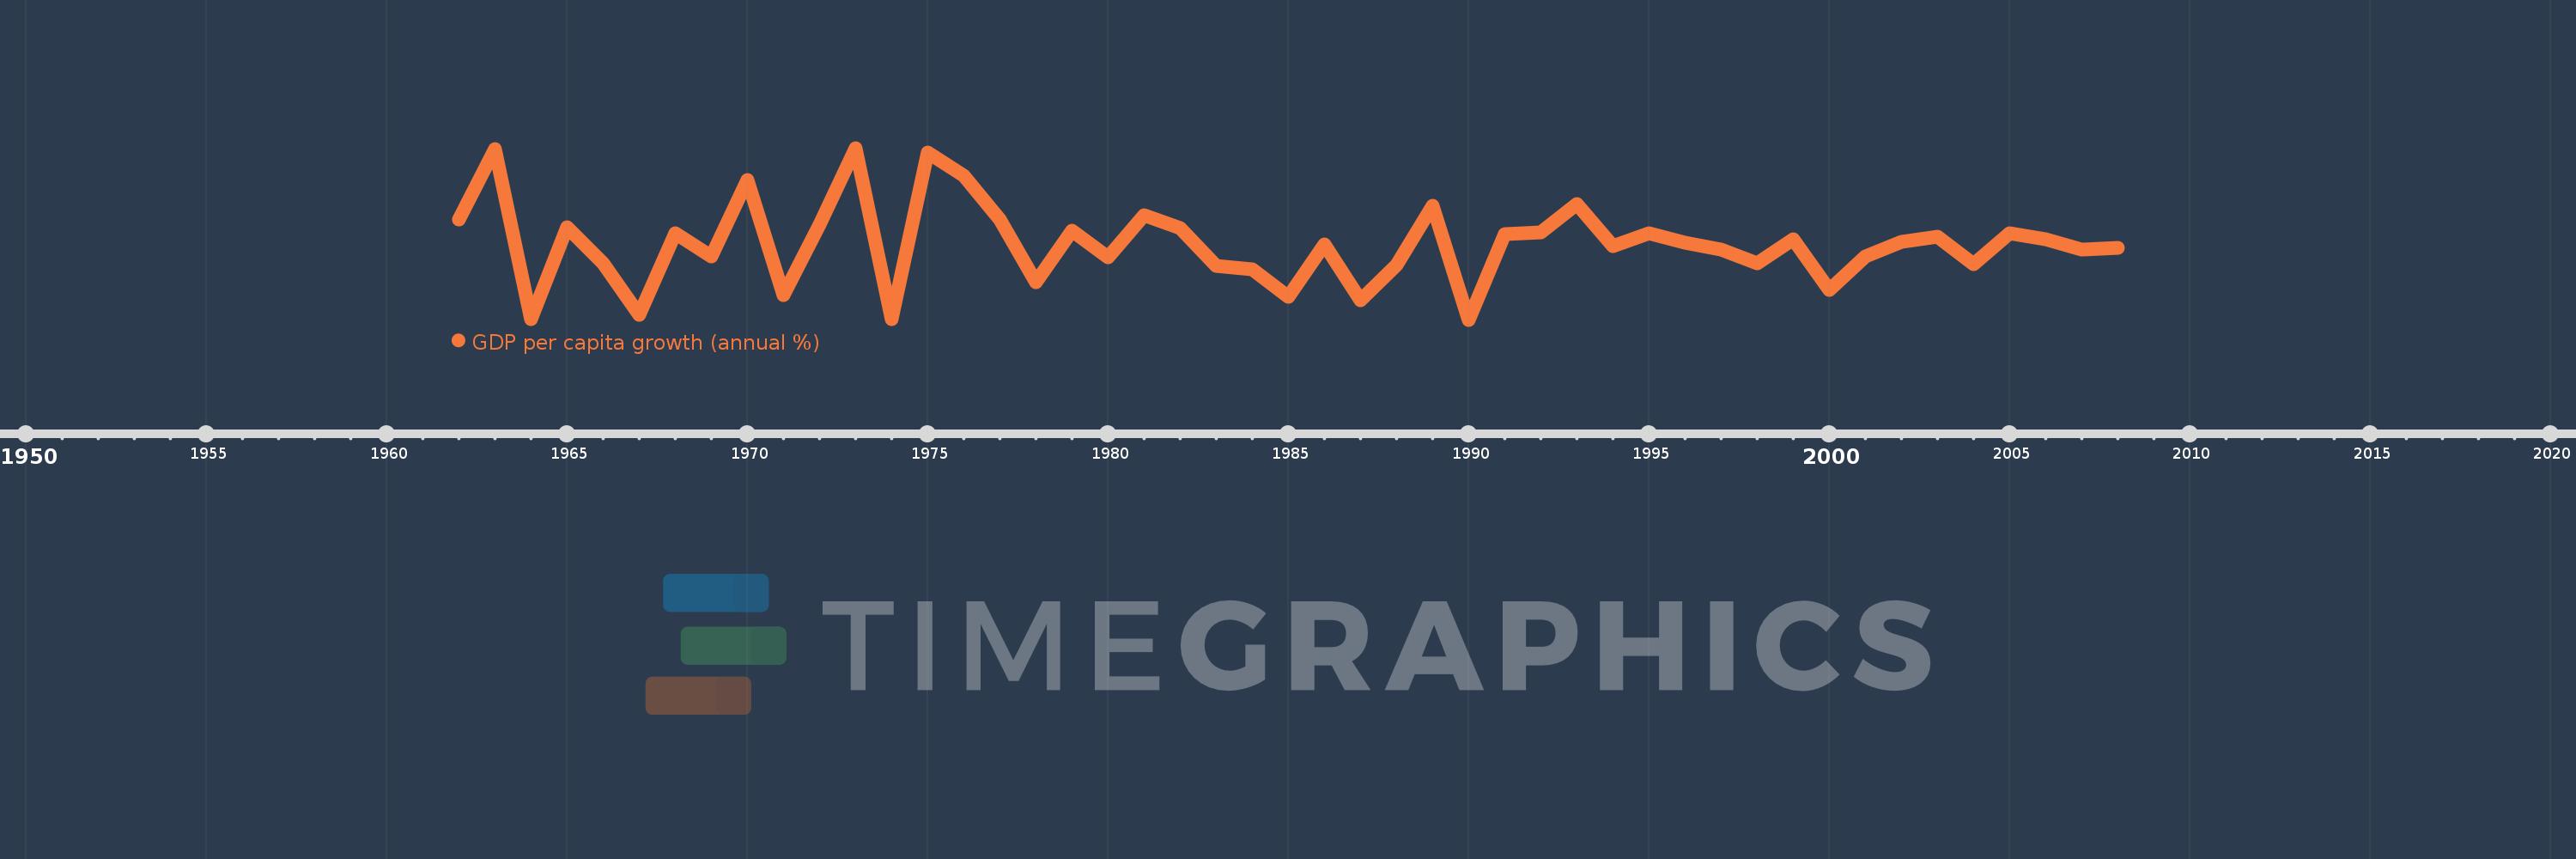
GDP per capita growth (annual %)
2008,2007,2006,2005,2004,2003,2002,2001,2000,1999,1998,1997,1996,1995,1994,1993,1992,1991,1990,1989,1988,1987,1986,1985,1984,1983,1982,1981,1980,1979,1978,1977,1976,1975,1974,1973,1972,1971,1970,1969,1968,1967,1966,1965,1964,1963,1962
Estas estadísticas en otros países:
AfghanistanAlbaniaAlgeriaAndorraAngolaAntigua and BarbudaArab WorldArgentinaArmeniaArubaAustraliaAustriaAzerbaijanBahamas, TheBahrainBangladeshBarbadosBelarusBelgiumBelizeBeninBermudaBhutanBoliviaBosnia and HerzegovinaBotswanaBrazilBrunei DarussalamBulgariaBurkina FasoBurundiCabo VerdeCambodiaCameroonCanadaCaribbean small statesCayman IslandsCentral African RepublicCentral Europe and the BalticsChadChannel IslandsChileChinaColombiaComorosCongo, Dem. Rep.Congo, Rep.Costa RicaCote d'IvoireCroatiaCubaCyprusCzech RepublicDenmarkDjiboutiDominicaDominican RepublicEarly-demographic dividendEast Asia & PacificEast Asia & Pacific (excluding high income)East Asia & Pacific (IDA & IBRD countries)EcuadorEgypt, Arab Rep.El SalvadorEquatorial GuineaEritreaEstoniaEthiopiaEuro areaEurope & Central AsiaEurope & Central Asia (excluding high income)Europe & Central Asia (IDA & IBRD countries)European UnionFijiFinlandFragile and conflict affected situationsFranceFrench PolynesiaGabonGambia, TheGeorgiaGermanyGhanaGreeceGreenlandGrenadaGuatemalaGuineaGuinea-BissauGuyanaHaitiHeavily indebted poor countries (HIPC)High incomeHondurasHong Kong SAR, ChinaHungaryIBRD onlyIcelandIDA & IBRD totalIDA blendIDA onlyIDA totalIndiaIndonesiaIran, Islamic Rep.IraqIrelandIsle of ManIsraelItalyJamaicaJapanJordanKazakhstanKenyaKiribatiKorea, Rep.KosovoKuwaitKyrgyz RepublicLao PDRLate-demographic dividendLatin America & Caribbean Latin America & Caribbean (excluding high income)Latin America & the Caribbean (IDA & IBRD countries)LatviaLeast developed countries: UN classificationLebanonLesothoLiberiaLibyaLiechtensteinLithuaniaLow & middle incomeLow incomeLower middle incomeLuxembourgMacao SAR, ChinaMacedonia, FYRMadagascarMalawiMalaysiaMaldivesMaliMaltaMarshall IslandsMauritaniaMauritiusMexicoMicronesia, Fed. Sts.Middle East & North AfricaMiddle East & North Africa (excluding high income)Middle East & North Africa (IDA & IBRD countries)Middle incomeMoldovaMonacoMongoliaMontenegroMoroccoMozambiqueMyanmarNamibiaNauruNepalNetherlandsNew CaledoniaNew ZealandNicaraguaNigerNigeriaNorth AmericaNorwayOECD membersOmanOther small statesPacific island small statesPakistanPalauPanamaPapua New GuineaParaguayPeruPhilippinesPolandPortugalPost-demographic dividendPre-demographic dividendPuerto RicoQatarRomaniaRussian FederationRwandaSamoaSan MarinoSao Tome and PrincipeSaudi ArabiaSenegalSerbiaSeychellesSierra LeoneSingaporeSlovak RepublicSloveniaSmall statesSolomon IslandsSomaliaSouth AfricaSouth AsiaSouth Asia (IDA & IBRD)South SudanSpainSri LankaSt. Kitts and NevisSt. LuciaSt. Vincent and the GrenadinesSub-Saharan Africa Sub-Saharan Africa (excluding high income)Sub-Saharan Africa (IDA & IBRD countries)SudanSurinameSwazilandSwedenSwitzerlandSyrian Arab RepublicTajikistanTanzaniaThailandTimor-LesteTogoTongaTrinidad and TobagoTunisiaTurkeyTurkmenistanTuvaluUgandaUkraineUnited Arab EmiratesUnited KingdomUnited StatesUpper middle incomeUruguayUzbekistanVanuatuVenezuela, RBVietnamVirgin Islands (U.S.)West Bank and GazaWorldYemen, Rep.ZambiaZimbabwe línea de tiempo (timeline):
En esta escala de tiempo se presenta un gráfico de 1962 y 2008 de Syrian Arab Republic. Los datos de 1961 están ausentes. El número de observaciones reales por fecha: 47.
Fuente (nombre):
Indicadores del desarrollo mundial
Fuente (organización):
World Bank national accounts data, and OECD National Accounts data files.
Categorías:
Economy & Growth
Se ha actualizado:
23 abr 2017 año
Los indicadores de los cambios de valor en los últimos años
Mínimo:
-11.658
1 ene 1990 año
Máximo:
20.828
1 ene 1973 año
A la fecha de observación
Valor
Cambio absoluto
El cambio con respecto al valor anterior
1 ene 1962 año
7.332
+7.332
0.0%
1 ene 1963 año
20.585
+13.253
180.76%
1 ene 1964 año
-11.55
-32.134
-156.11%
1 ene 1965 año
5.784
+17.333
-150.08%
1 ene 1966 año
-0.993
-6.777
-117.17%
1 ene 1967 año
-10.654
-9.661
972.58%
1 ene 1968 año
4.725
+15.379
-144.35%
1 ene 1969 año
0.324
-4.401
-93.15%
1 ene 1970 año
14.845
+14.521
4.49 mil%
1 ene 1971 año
-7.003
-21.848
-147.17%
1 ene 1972 año
6.242
+13.245
-189.14%
1 ene 1973 año
20.828
+14.585
233.65%
1 ene 1974 año
-11.622
-32.449
-155.8%
1 ene 1975 año
19.964
+31.586
-271.79%
1 ene 1976 año
15.538
-4.427
-22.17%
1 ene 1977 año
7.293
-8.244
-53.06%
1 ene 1978 año
-4.515
-11.808
-161.9%
1 ene 1979 año
5.149
+9.664
-214.04%
1 ene 1980 año
0.176
-4.973
-96.58%
1 ene 1981 año
8.179
+8.003
4.55 mil%
1 ene 1982 año
5.717
-2.462
-30.1%
1 ene 1983 año
-1.45
-7.167
-125.36%
1 ene 1984 año
-2.107
-0.658
45.36%
1 ene 1985 año
-7.352
-5.244
248.85%
1 ene 1986 año
2.596
+9.948
-135.31%
1 ene 1987 año
-7.994
-10.59
-407.96%
1 ene 1988 año
-1.264
+6.73
-84.18%
1 ene 1989 año
9.834
+11.099
-877.74%
1 ene 1990 año
-11.658
-21.492
-218.55%
1 ene 1991 año
4.504
+16.162
-138.64%
1 ene 1992 año
4.82
+0.316
7.01%
1 ene 1993 año
10.298
+5.478
113.66%
1 ene 1994 año
2.282
-8.016
-77.84%
1 ene 1995 año
4.708
+2.426
106.29%
1 ene 1996 año
2.865
-1.842
-39.14%
1 ene 1997 año
1.536
-1.329
-46.39%
1 ene 1998 año
-0.993
-2.529
-164.66%
1 ene 1999 año
3.49
+4.483
-451.38%
1 ene 2000 año
-5.991
-9.481
-271.65%
1 ene 2001 año
0.345
+6.336
-105.76%
1 ene 2002 año
3.056
+2.711
784.9%
1 ene 2003 año
4.012
+0.955
31.26%
1 ene 2004 año
-1.184
-5.195
-129.51%
1 ene 2005 año
4.676
+5.86
-495.07%
1 ene 2006 año
3.5
-1.176
-25.15%
1 ene 2007 año
1.662
-1.838
-52.52%
1 ene 2008 año
1.905
+0.243
14.63%
Ranking de los países por los datos estadísticos actuales


Comentarios: