29
/es/
es
AIzaSyAYiBZKx7MnpbEhh9jyipgxe19OcubqV5w
April 1, 2024
211710
Niger
NER
true
2
1
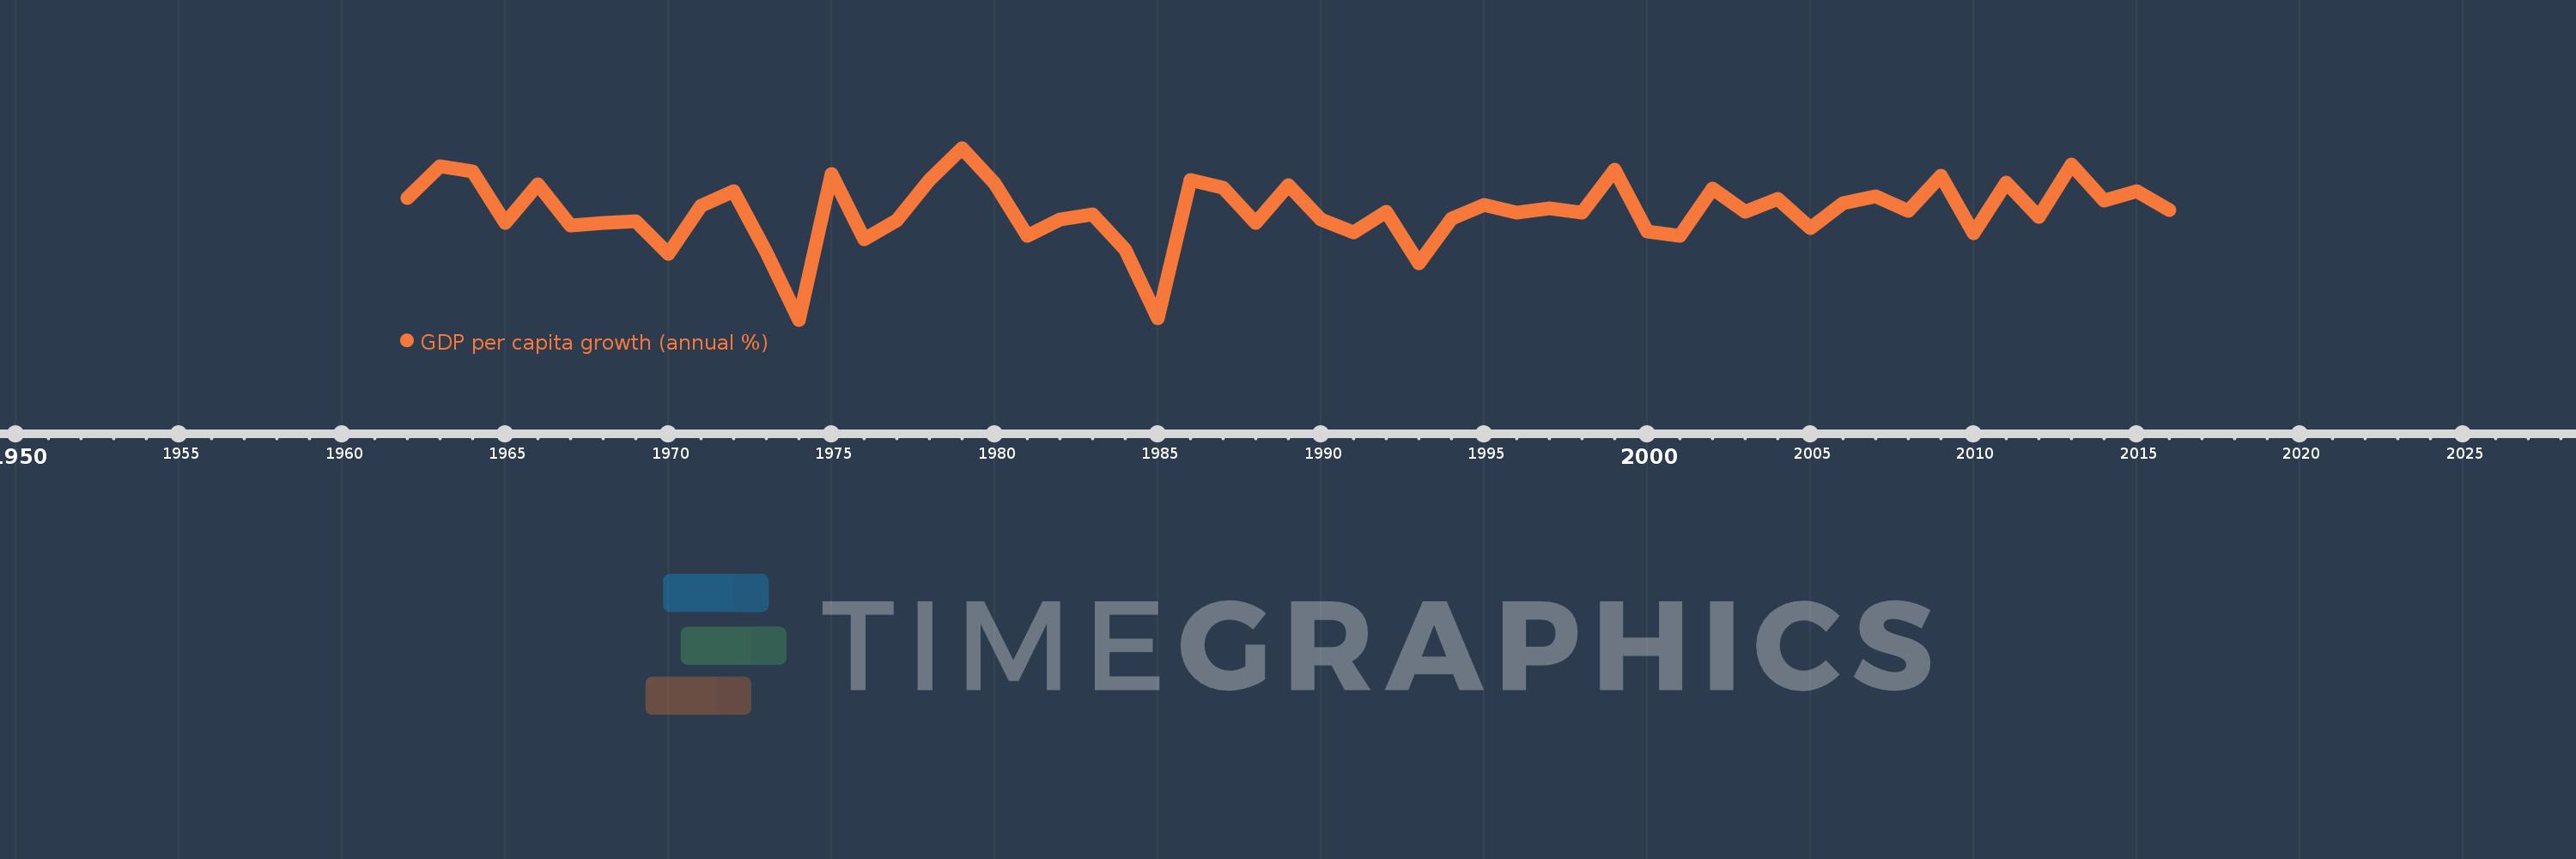
GDP per capita growth (annual %)
2016,2015,2014,2013,2012,2011,2010,2009,2008,2007,2006,2005,2004,2003,2002,2001,2000,1999,1998,1997,1996,1995,1994,1993,1992,1991,1990,1989,1988,1987,1986,1985,1984,1983,1982,1981,1980,1979,1978,1977,1976,1975,1974,1973,1972,1971,1970,1969,1968,1967,1966,1965,1964,1963,1962
Estas estadísticas en otros países:
AfghanistanAlbaniaAlgeriaAndorraAngolaAntigua and BarbudaArab WorldArgentinaArmeniaArubaAustraliaAustriaAzerbaijanBahamas, TheBahrainBangladeshBarbadosBelarusBelgiumBelizeBeninBermudaBhutanBoliviaBosnia and HerzegovinaBotswanaBrazilBrunei DarussalamBulgariaBurkina FasoBurundiCabo VerdeCambodiaCameroonCanadaCaribbean small statesCayman IslandsCentral African RepublicCentral Europe and the BalticsChadChannel IslandsChileChinaColombiaComorosCongo, Dem. Rep.Congo, Rep.Costa RicaCote d'IvoireCroatiaCubaCyprusCzech RepublicDenmarkDjiboutiDominicaDominican RepublicEarly-demographic dividendEast Asia & PacificEast Asia & Pacific (excluding high income)East Asia & Pacific (IDA & IBRD countries)EcuadorEgypt, Arab Rep.El SalvadorEquatorial GuineaEritreaEstoniaEthiopiaEuro areaEurope & Central AsiaEurope & Central Asia (excluding high income)Europe & Central Asia (IDA & IBRD countries)European UnionFijiFinlandFragile and conflict affected situationsFranceFrench PolynesiaGabonGambia, TheGeorgiaGermanyGhanaGreeceGreenlandGrenadaGuatemalaGuineaGuinea-BissauGuyanaHaitiHeavily indebted poor countries (HIPC)High incomeHondurasHong Kong SAR, ChinaHungaryIBRD onlyIcelandIDA & IBRD totalIDA blendIDA onlyIDA totalIndiaIndonesiaIran, Islamic Rep.IraqIrelandIsle of ManIsraelItalyJamaicaJapanJordanKazakhstanKenyaKiribatiKorea, Rep.KosovoKuwaitKyrgyz RepublicLao PDRLate-demographic dividendLatin America & Caribbean Latin America & Caribbean (excluding high income)Latin America & the Caribbean (IDA & IBRD countries)LatviaLeast developed countries: UN classificationLebanonLesothoLiberiaLibyaLiechtensteinLithuaniaLow & middle incomeLow incomeLower middle incomeLuxembourgMacao SAR, ChinaMacedonia, FYRMadagascarMalawiMalaysiaMaldivesMaliMaltaMarshall IslandsMauritaniaMauritiusMexicoMicronesia, Fed. Sts.Middle East & North AfricaMiddle East & North Africa (excluding high income)Middle East & North Africa (IDA & IBRD countries)Middle incomeMoldovaMonacoMongoliaMontenegroMoroccoMozambiqueMyanmarNamibiaNauruNepalNetherlandsNew CaledoniaNew ZealandNicaraguaNigerNigeriaNorth AmericaNorwayOECD membersOmanOther small statesPacific island small statesPakistanPalauPanamaPapua New GuineaParaguayPeruPhilippinesPolandPortugalPost-demographic dividendPre-demographic dividendPuerto RicoQatarRomaniaRussian FederationRwandaSamoaSan MarinoSao Tome and PrincipeSaudi ArabiaSenegalSerbiaSeychellesSierra LeoneSingaporeSlovak RepublicSloveniaSmall statesSolomon IslandsSomaliaSouth AfricaSouth AsiaSouth Asia (IDA & IBRD)South SudanSpainSri LankaSt. Kitts and NevisSt. LuciaSt. Vincent and the GrenadinesSub-Saharan Africa Sub-Saharan Africa (excluding high income)Sub-Saharan Africa (IDA & IBRD countries)SudanSurinameSwazilandSwedenSwitzerlandSyrian Arab RepublicTajikistanTanzaniaThailandTimor-LesteTogoTongaTrinidad and TobagoTunisiaTurkeyTurkmenistanTuvaluUgandaUkraineUnited Arab EmiratesUnited KingdomUnited StatesUpper middle incomeUruguayUzbekistanVanuatuVenezuela, RBVietnamVirgin Islands (U.S.)West Bank and GazaWorldYemen, Rep.ZambiaZimbabwe línea de tiempo (timeline):
En esta escala de tiempo se presenta un gráfico de 1962 y 2016 de Niger. Los datos de 1961 están ausentes. El número de observaciones reales por fecha: 55.
Fuente (nombre):
Indicadores del desarrollo mundial
Fuente (organización):
World Bank national accounts data, and OECD National Accounts data files.
Categorías:
Economy & Growth
Se ha actualizado:
23 abr 2017 año
Los indicadores de los cambios de valor en los últimos años
Mínimo:
-19.329
1 ene 1974 año
Máximo:
10.256
1 ene 1979 año
A la fecha de observación
Valor
Cambio absoluto
El cambio con respecto al valor anterior
1 ene 1962 año
1.601
+1.601
0.0%
1 ene 1963 año
7.121
+5.52
344.78%
1 ene 1964 año
6.28
-0.841
-11.82%
1 ene 1965 año
-2.723
-9.003
-143.36%
1 ene 1966 año
3.927
+6.65
-244.21%
1 ene 1967 año
-3.116
-7.043
-179.34%
1 ene 1968 año
-2.584
+0.532
-17.07%
1 ene 1969 año
-2.308
+0.276
-10.67%
1 ene 1970 año
-8.022
-5.714
247.58%
1 ene 1971 año
0.271
+8.293
-103.38%
1 ene 1972 año
2.804
+2.533
934.0%
1 ene 1973 año
-7.759
-10.563
-376.66%
1 ene 1974 año
-19.329
-11.57
149.13%
1 ene 1975 año
5.762
+25.091
-129.81%
1 ene 1976 año
-5.506
-11.267
-195.55%
1 ene 1977 año
-2.157
+3.349
-60.82%
1 ene 1978 año
4.708
+6.865
-318.26%
1 ene 1979 año
10.256
+5.549
117.86%
1 ene 1980 año
4.142
-6.114
-59.62%
1 ene 1981 año
-4.931
-9.073
-219.04%
1 ene 1982 año
-2.126
+2.805
-56.89%
1 ene 1983 año
-1.113
+1.013
-47.65%
1 ene 1984 año
-7.306
-6.193
556.63%
1 ene 1985 año
-19.065
-11.759
160.96%
1 ene 1986 año
4.792
+23.857
-125.13%
1 ene 1987 año
3.433
-1.358
-28.35%
1 ene 1988 año
-2.717
-6.151
-179.15%
1 ene 1989 año
3.851
+6.568
-241.72%
1 ene 1990 año
-2.032
-5.883
-152.77%
1 ene 1991 año
-4.287
-2.255
110.93%
1 ene 1992 año
-0.72
+3.567
-83.2%
1 ene 1993 año
-9.545
-8.825
1.23 mil%
1 ene 1994 año
-1.922
+7.623
-79.87%
1 ene 1995 año
0.477
+2.399
-124.82%
1 ene 1996 año
-0.932
-1.409
-295.49%
1 ene 1997 año
-0.203
+0.729
-78.19%
1 ene 1998 año
-0.895
-0.692
340.29%
1 ene 1999 año
6.467
+7.362
-822.4%
1 ene 2000 año
-4.141
-10.608
-164.03%
1 ene 2001 año
-4.95
-0.809
19.54%
1 ene 2002 año
3.261
+8.211
-165.88%
1 ene 2003 año
-0.7
-3.961
-121.46%
1 ene 2004 año
1.511
+2.211
-315.91%
1 ene 2005 año
-3.515
-5.026
-332.58%
1 ene 2006 año
0.707
+4.222
-120.13%
1 ene 2007 año
1.944
+1.237
174.8%
1 ene 2008 año
-0.631
-2.575
-132.48%
1 ene 2009 año
5.538
+6.169
-977.1%
1 ene 2010 año
-4.432
-9.97
-180.03%
1 ene 2011 año
4.247
+8.678
-195.82%
1 ene 2012 año
-1.64
-5.887
-138.62%
1 ene 2013 año
7.443
+9.083
-553.87%
1 ene 2014 año
1.122
-6.321
-84.92%
1 ene 2015 año
2.822
+1.7
151.46%
1 ene 2016 año
-0.484
-3.306
-117.15%
Ranking de los países por los datos estadísticos actuales


Comentarios: