29
/es/
es
AIzaSyAYiBZKx7MnpbEhh9jyipgxe19OcubqV5w
April 1, 2024
84090
Benin
BEN
true
2
1
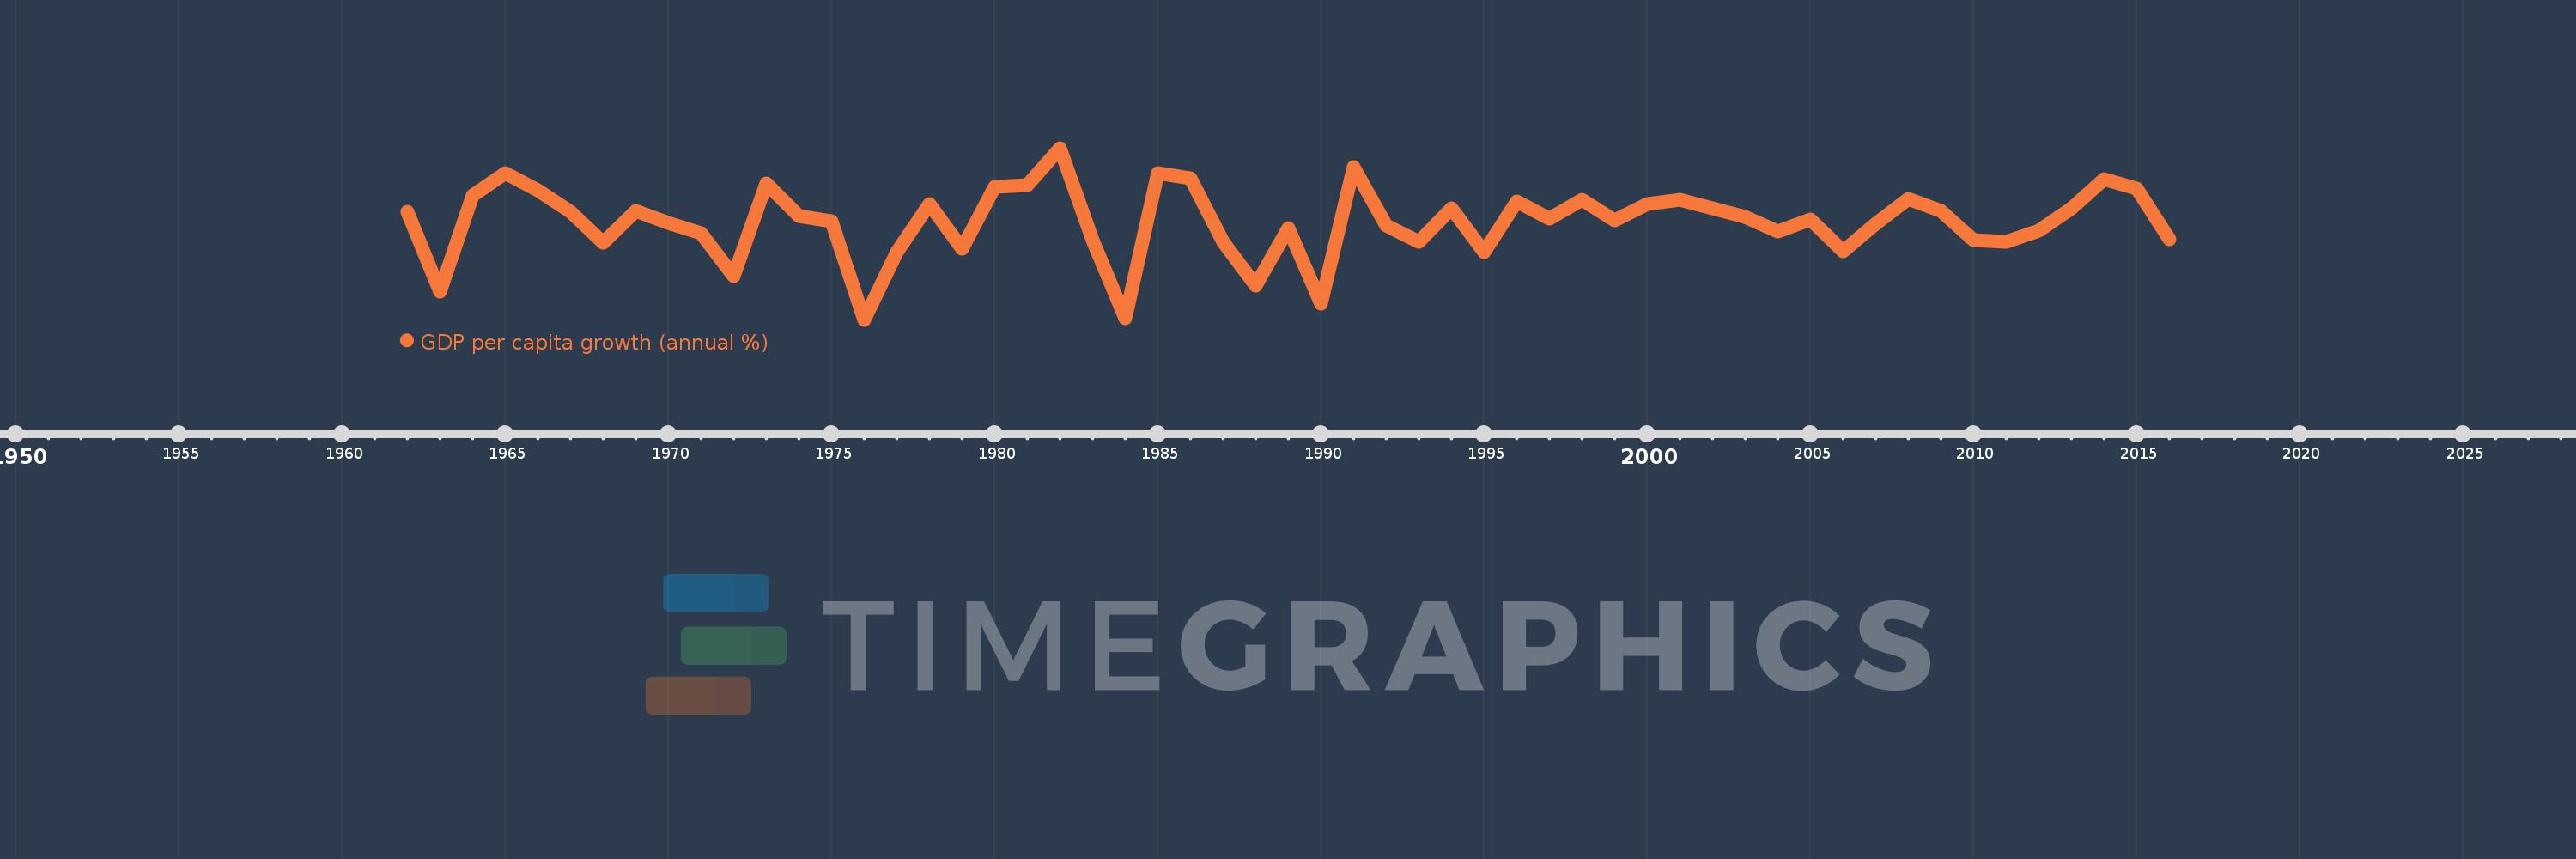
GDP per capita growth (annual %)
2016,2015,2014,2013,2012,2011,2010,2009,2008,2007,2006,2005,2004,2003,2002,2001,2000,1999,1998,1997,1996,1995,1994,1993,1992,1991,1990,1989,1988,1987,1986,1985,1984,1983,1982,1981,1980,1979,1978,1977,1976,1975,1974,1973,1972,1971,1970,1969,1968,1967,1966,1965,1964,1963,1962
Estas estadísticas en otros países:
AfghanistanAlbaniaAlgeriaAndorraAngolaAntigua and BarbudaArab WorldArgentinaArmeniaArubaAustraliaAustriaAzerbaijanBahamas, TheBahrainBangladeshBarbadosBelarusBelgiumBelizeBeninBermudaBhutanBoliviaBosnia and HerzegovinaBotswanaBrazilBrunei DarussalamBulgariaBurkina FasoBurundiCabo VerdeCambodiaCameroonCanadaCaribbean small statesCayman IslandsCentral African RepublicCentral Europe and the BalticsChadChannel IslandsChileChinaColombiaComorosCongo, Dem. Rep.Congo, Rep.Costa RicaCote d'IvoireCroatiaCubaCyprusCzech RepublicDenmarkDjiboutiDominicaDominican RepublicEarly-demographic dividendEast Asia & PacificEast Asia & Pacific (excluding high income)East Asia & Pacific (IDA & IBRD countries)EcuadorEgypt, Arab Rep.El SalvadorEquatorial GuineaEritreaEstoniaEthiopiaEuro areaEurope & Central AsiaEurope & Central Asia (excluding high income)Europe & Central Asia (IDA & IBRD countries)European UnionFijiFinlandFragile and conflict affected situationsFranceFrench PolynesiaGabonGambia, TheGeorgiaGermanyGhanaGreeceGreenlandGrenadaGuatemalaGuineaGuinea-BissauGuyanaHaitiHeavily indebted poor countries (HIPC)High incomeHondurasHong Kong SAR, ChinaHungaryIBRD onlyIcelandIDA & IBRD totalIDA blendIDA onlyIDA totalIndiaIndonesiaIran, Islamic Rep.IraqIrelandIsle of ManIsraelItalyJamaicaJapanJordanKazakhstanKenyaKiribatiKorea, Rep.KosovoKuwaitKyrgyz RepublicLao PDRLate-demographic dividendLatin America & Caribbean Latin America & Caribbean (excluding high income)Latin America & the Caribbean (IDA & IBRD countries)LatviaLeast developed countries: UN classificationLebanonLesothoLiberiaLibyaLiechtensteinLithuaniaLow & middle incomeLow incomeLower middle incomeLuxembourgMacao SAR, ChinaMacedonia, FYRMadagascarMalawiMalaysiaMaldivesMaliMaltaMarshall IslandsMauritaniaMauritiusMexicoMicronesia, Fed. Sts.Middle East & North AfricaMiddle East & North Africa (excluding high income)Middle East & North Africa (IDA & IBRD countries)Middle incomeMoldovaMonacoMongoliaMontenegroMoroccoMozambiqueMyanmarNamibiaNauruNepalNetherlandsNew CaledoniaNew ZealandNicaraguaNigerNigeriaNorth AmericaNorwayOECD membersOmanOther small statesPacific island small statesPakistanPalauPanamaPapua New GuineaParaguayPeruPhilippinesPolandPortugalPost-demographic dividendPre-demographic dividendPuerto RicoQatarRomaniaRussian FederationRwandaSamoaSan MarinoSao Tome and PrincipeSaudi ArabiaSenegalSerbiaSeychellesSierra LeoneSingaporeSlovak RepublicSloveniaSmall statesSolomon IslandsSomaliaSouth AfricaSouth AsiaSouth Asia (IDA & IBRD)South SudanSpainSri LankaSt. Kitts and NevisSt. LuciaSt. Vincent and the GrenadinesSub-Saharan Africa Sub-Saharan Africa (excluding high income)Sub-Saharan Africa (IDA & IBRD countries)SudanSurinameSwazilandSwedenSwitzerlandSyrian Arab RepublicTajikistanTanzaniaThailandTimor-LesteTogoTongaTrinidad and TobagoTunisiaTurkeyTurkmenistanTuvaluUgandaUkraineUnited Arab EmiratesUnited KingdomUnited StatesUpper middle incomeUruguayUzbekistanVanuatuVenezuela, RBVietnamVirgin Islands (U.S.)West Bank and GazaWorldYemen, Rep.ZambiaZimbabwe línea de tiempo (timeline):
En esta escala de tiempo se presenta un gráfico de 1962 y 2016 de Benin. Los datos de 1961 están ausentes. El número de observaciones reales por fecha: 55.
Fuente (nombre):
Indicadores del desarrollo mundial
Fuente (organización):
World Bank national accounts data, and OECD National Accounts data files.
Categorías:
Economy & Growth
Se ha actualizado:
23 abr 2017 año
Los indicadores de los cambios de valor en los últimos años
Mínimo:
-7.181
1 ene 1976 año
Máximo:
6.957
1 ene 1982 año
A la fecha de observación
Valor
Cambio absoluto
El cambio con respecto al valor anterior
1 ene 1962 año
1.703
+1.703
0.0%
1 ene 1963 año
-4.863
-6.566
-385.5%
1 ene 1964 año
3.079
+7.941
-163.31%
1 ene 1965 año
4.877
+1.798
58.4%
1 ene 1966 año
3.454
-1.423
-29.17%
1 ene 1967 año
1.682
-1.772
-51.29%
1 ene 1968 año
-0.847
-2.529
-150.35%
1 ene 1969 año
1.79
+2.637
-311.39%
1 ene 1970 año
0.778
-1.013
-56.56%
1 ene 1971 año
-0.048
-0.826
-106.2%
1 ene 1972 año
-3.624
-3.576
7.42 mil%
1 ene 1973 año
4.068
+7.691
-212.25%
1 ene 1974 año
1.346
-2.721
-66.91%
1 ene 1975 año
0.923
-0.424
-31.46%
1 ene 1976 año
-7.181
-8.103
-878.28%
1 ene 1977 año
-1.605
+5.576
-77.65%
1 ene 1978 año
2.33
+3.935
-245.19%
1 ene 1979 año
-1.36
-3.69
-158.39%
1 ene 1980 año
3.732
+5.092
-374.31%
1 ene 1981 año
3.924
+0.192
5.14%
1 ene 1982 año
6.957
+3.034
77.31%
1 ene 1983 año
-0.603
-7.561
-108.67%
1 ene 1984 año
-7.043
-6.44
1.07 mil%
1 ene 1985 año
4.855
+11.899
-168.94%
1 ene 1986 año
4.438
-0.417
-8.6%
1 ene 1987 año
-0.773
-5.21
-117.41%
1 ene 1988 año
-4.353
-3.581
463.48%
1 ene 1989 año
0.332
+4.685
-107.63%
1 ene 1990 año
-5.885
-6.217
-1.87 mil%
1 ene 1991 año
5.38
+11.265
-191.43%
1 ene 1992 año
0.581
-4.8
-89.21%
1 ene 1993 año
-0.789
-1.369
-235.84%
1 ene 1994 año
1.965
+2.754
-349.14%
1 ene 1995 año
-1.583
-3.548
-180.55%
1 ene 1996 año
2.522
+4.105
-259.35%
1 ene 1997 año
1.104
-1.418
-56.23%
1 ene 1998 año
2.66
+1.556
140.97%
1 ene 1999 año
1.02
-1.64
-61.65%
1 ene 2000 año
2.31
+1.29
126.41%
1 ene 2001 año
2.678
+0.369
15.96%
1 ene 2002 año
2.019
-0.659
-24.6%
1 ene 2003 año
1.26
-0.76
-37.62%
1 ene 2004 año
0.058
-1.202
-95.41%
1 ene 2005 año
1.041
+0.983
1.7 mil%
1 ene 2006 año
-1.515
-2.556
-245.58%
1 ene 2007 año
0.73
+2.245
-148.16%
1 ene 2008 año
2.774
+2.045
280.24%
1 ene 2009 año
1.785
-0.989
-35.64%
1 ene 2010 año
-0.642
-2.428
-135.97%
1 ene 2011 año
-0.77
-0.128
19.87%
1 ene 2012 año
0.124
+0.894
-116.15%
1 ene 2013 año
1.99
+1.866
1.5 mil%
1 ene 2014 año
4.364
+2.374
119.26%
1 ene 2015 año
3.585
-0.779
-17.84%
1 ene 2016 año
-0.546
-4.131
-115.22%
Ranking de los países por los datos estadísticos actuales


Comentarios: