29
/es/
es
AIzaSyAYiBZKx7MnpbEhh9jyipgxe19OcubqV5w
April 1, 2024
66003
Algeria
DZA
true
2
1
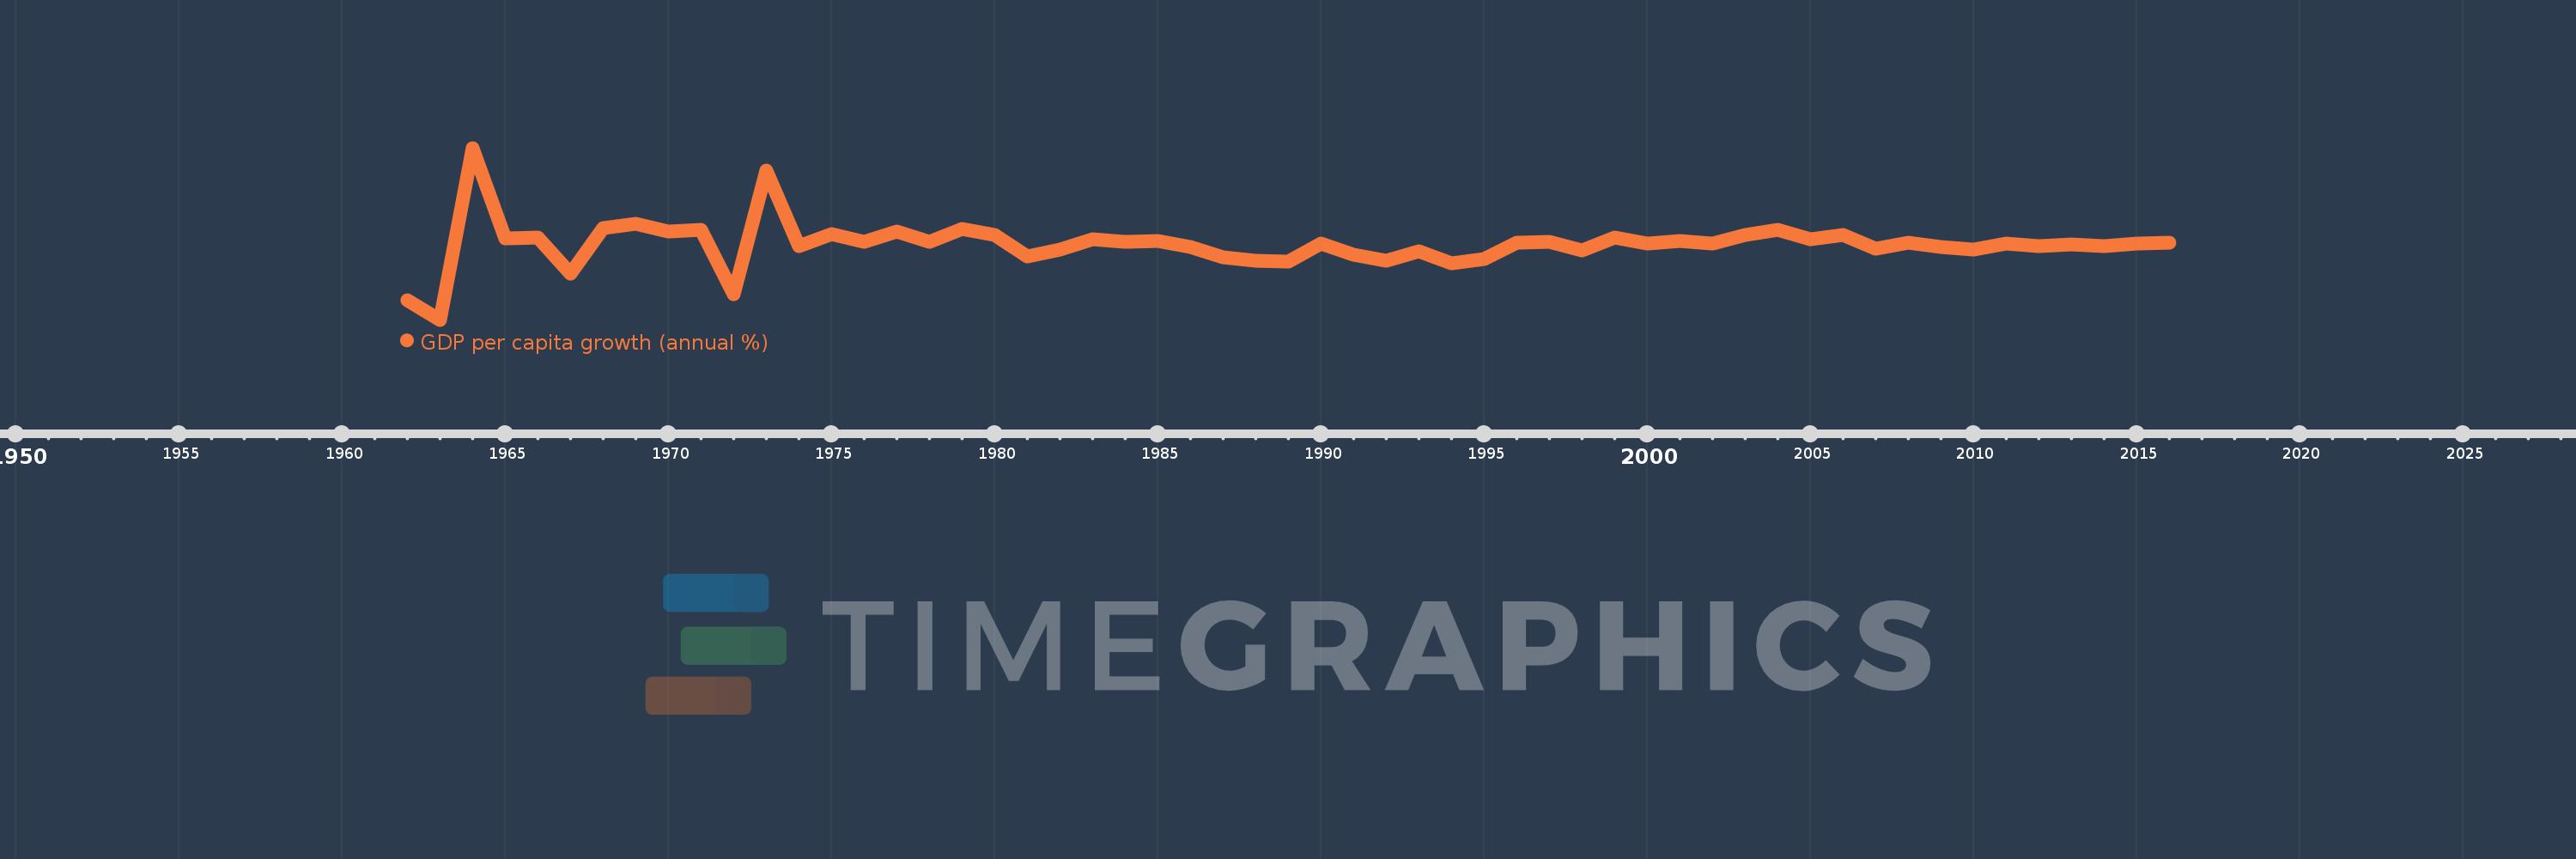
GDP per capita growth (annual %)
2016,2015,2014,2013,2012,2011,2010,2009,2008,2007,2006,2005,2004,2003,2002,2001,2000,1999,1998,1997,1996,1995,1994,1993,1992,1991,1990,1989,1988,1987,1986,1985,1984,1983,1982,1981,1980,1979,1978,1977,1976,1975,1974,1973,1972,1971,1970,1969,1968,1967,1966,1965,1964,1963,1962
Estas estadísticas en otros países:
AfghanistanAlbaniaAlgeriaAndorraAngolaAntigua and BarbudaArab WorldArgentinaArmeniaArubaAustraliaAustriaAzerbaijanBahamas, TheBahrainBangladeshBarbadosBelarusBelgiumBelizeBeninBermudaBhutanBoliviaBosnia and HerzegovinaBotswanaBrazilBrunei DarussalamBulgariaBurkina FasoBurundiCabo VerdeCambodiaCameroonCanadaCaribbean small statesCayman IslandsCentral African RepublicCentral Europe and the BalticsChadChannel IslandsChileChinaColombiaComorosCongo, Dem. Rep.Congo, Rep.Costa RicaCote d'IvoireCroatiaCubaCyprusCzech RepublicDenmarkDjiboutiDominicaDominican RepublicEarly-demographic dividendEast Asia & PacificEast Asia & Pacific (excluding high income)East Asia & Pacific (IDA & IBRD countries)EcuadorEgypt, Arab Rep.El SalvadorEquatorial GuineaEritreaEstoniaEthiopiaEuro areaEurope & Central AsiaEurope & Central Asia (excluding high income)Europe & Central Asia (IDA & IBRD countries)European UnionFijiFinlandFragile and conflict affected situationsFranceFrench PolynesiaGabonGambia, TheGeorgiaGermanyGhanaGreeceGreenlandGrenadaGuatemalaGuineaGuinea-BissauGuyanaHaitiHeavily indebted poor countries (HIPC)High incomeHondurasHong Kong SAR, ChinaHungaryIBRD onlyIcelandIDA & IBRD totalIDA blendIDA onlyIDA totalIndiaIndonesiaIran, Islamic Rep.IraqIrelandIsle of ManIsraelItalyJamaicaJapanJordanKazakhstanKenyaKiribatiKorea, Rep.KosovoKuwaitKyrgyz RepublicLao PDRLate-demographic dividendLatin America & Caribbean Latin America & Caribbean (excluding high income)Latin America & the Caribbean (IDA & IBRD countries)LatviaLeast developed countries: UN classificationLebanonLesothoLiberiaLibyaLiechtensteinLithuaniaLow & middle incomeLow incomeLower middle incomeLuxembourgMacao SAR, ChinaMacedonia, FYRMadagascarMalawiMalaysiaMaldivesMaliMaltaMarshall IslandsMauritaniaMauritiusMexicoMicronesia, Fed. Sts.Middle East & North AfricaMiddle East & North Africa (excluding high income)Middle East & North Africa (IDA & IBRD countries)Middle incomeMoldovaMonacoMongoliaMontenegroMoroccoMozambiqueMyanmarNamibiaNauruNepalNetherlandsNew CaledoniaNew ZealandNicaraguaNigerNigeriaNorth AmericaNorwayOECD membersOmanOther small statesPacific island small statesPakistanPalauPanamaPapua New GuineaParaguayPeruPhilippinesPolandPortugalPost-demographic dividendPre-demographic dividendPuerto RicoQatarRomaniaRussian FederationRwandaSamoaSan MarinoSao Tome and PrincipeSaudi ArabiaSenegalSerbiaSeychellesSierra LeoneSingaporeSlovak RepublicSloveniaSmall statesSolomon IslandsSomaliaSouth AfricaSouth AsiaSouth Asia (IDA & IBRD)South SudanSpainSri LankaSt. Kitts and NevisSt. LuciaSt. Vincent and the GrenadinesSub-Saharan Africa Sub-Saharan Africa (excluding high income)Sub-Saharan Africa (IDA & IBRD countries)SudanSurinameSwazilandSwedenSwitzerlandSyrian Arab RepublicTajikistanTanzaniaThailandTimor-LesteTogoTongaTrinidad and TobagoTunisiaTurkeyTurkmenistanTuvaluUgandaUkraineUnited Arab EmiratesUnited KingdomUnited StatesUpper middle incomeUruguayUzbekistanVanuatuVenezuela, RBVietnamVirgin Islands (U.S.)West Bank and GazaWorldYemen, Rep.ZambiaZimbabwe línea de tiempo (timeline):
En esta escala de tiempo se presenta un gráfico de 1962 y 2016 de Algeria. Los datos de 1961 están ausentes. El número de observaciones reales por fecha: 55.
Fuente (nombre):
Indicadores del desarrollo mundial
Fuente (organización):
World Bank national accounts data, and OECD National Accounts data files.
Categorías:
Economy & Growth
Se ha actualizado:
23 abr 2017 año
Los indicadores de los cambios de valor en los últimos años
Mínimo:
-21.645
1 ene 1963 año
Máximo:
31.008
1 ene 1964 año
A la fecha de observación
Valor
Cambio absoluto
El cambio con respecto al valor anterior
1 ene 1962 año
-15.726
-15.726
0.0%
1 ene 1963 año
-21.645
-5.919
37.64%
1 ene 1964 año
31.008
+52.653
-243.26%
1 ene 1965 año
3.164
-27.844
-89.8%
1 ene 1966 año
3.423
+0.259
8.19%
1 ene 1967 año
-7.396
-10.819
-316.07%
1 ene 1968 año
6.388
+13.784
-186.37%
1 ene 1969 año
7.651
+1.263
19.77%
1 ene 1970 año
5.366
-2.284
-29.86%
1 ene 1971 año
5.828
+0.462
8.6%
1 ene 1972 año
-13.762
-19.59
-336.14%
1 ene 1973 año
23.969
+37.731
-274.16%
1 ene 1974 año
1.006
-22.962
-95.8%
1 ene 1975 año
4.566
+3.56
353.79%
1 ene 1976 año
2.141
-2.425
-53.11%
1 ene 1977 año
5.353
+3.212
150.03%
1 ene 1978 año
2.284
-3.069
-57.34%
1 ene 1979 año
6.084
+3.8
166.38%
1 ene 1980 año
4.336
-1.748
-28.73%
1 ene 1981 año
-2.217
-6.553
-151.12%
1 ene 1982 año
-0.129
+2.087
-94.16%
1 ene 1983 año
3.132
+3.261
-2.52 mil%
1 ene 1984 año
2.16
-0.972
-31.03%
1 ene 1985 año
2.39
+0.23
10.64%
1 ene 1986 año
0.612
-1.778
-74.41%
1 ene 1987 año
-2.518
-3.129
-511.6%
1 ene 1988 año
-3.509
-0.992
39.39%
1 ene 1989 año
-3.712
-0.203
5.78%
1 ene 1990 año
1.646
+5.358
-144.36%
1 ene 1991 año
-1.747
-3.393
-206.1%
1 ene 1992 año
-3.588
-1.842
105.43%
1 ene 1993 año
-0.547
+3.041
-84.76%
1 ene 1994 año
-4.232
-3.685
673.71%
1 ene 1995 año
-2.913
+1.319
-31.17%
1 ene 1996 año
1.853
+4.765
-163.6%
1 ene 1997 año
2.304
+0.451
24.35%
1 ene 1998 año
-0.51
-2.813
-122.13%
1 ene 1999 año
3.544
+4.054
-795.25%
1 ene 2000 año
1.759
-1.785
-50.37%
1 ene 2001 año
2.412
+0.653
37.12%
1 ene 2002 año
1.674
-0.738
-30.58%
1 ene 2003 año
4.279
+2.605
155.63%
1 ene 2004 año
5.861
+1.582
36.97%
1 ene 2005 año
2.958
-2.904
-49.54%
1 ene 2006 año
4.465
+1.508
50.98%
1 ene 2007 año
0.249
-4.216
-94.42%
1 ene 2008 año
1.853
+1.604
643.45%
1 ene 2009 año
0.785
-1.068
-57.64%
1 ene 2010 año
-0.095
-0.88
-112.15%
1 ene 2011 año
1.776
+1.872
-1.96 mil%
1 ene 2012 año
0.992
-0.785
-44.18%
1 ene 2013 año
1.405
+0.414
41.71%
1 ene 2014 año
0.79
-0.615
-43.79%
1 ene 2015 año
1.805
+1.015
128.57%
1 ene 2016 año
1.982
+0.177
9.8%
Ranking de los países por los datos estadísticos actuales


Comentarios: