29
/es/
es
AIzaSyAYiBZKx7MnpbEhh9jyipgxe19OcubqV5w
April 1, 2024
113586
Cote d'Ivoire
CIV
true
2
1
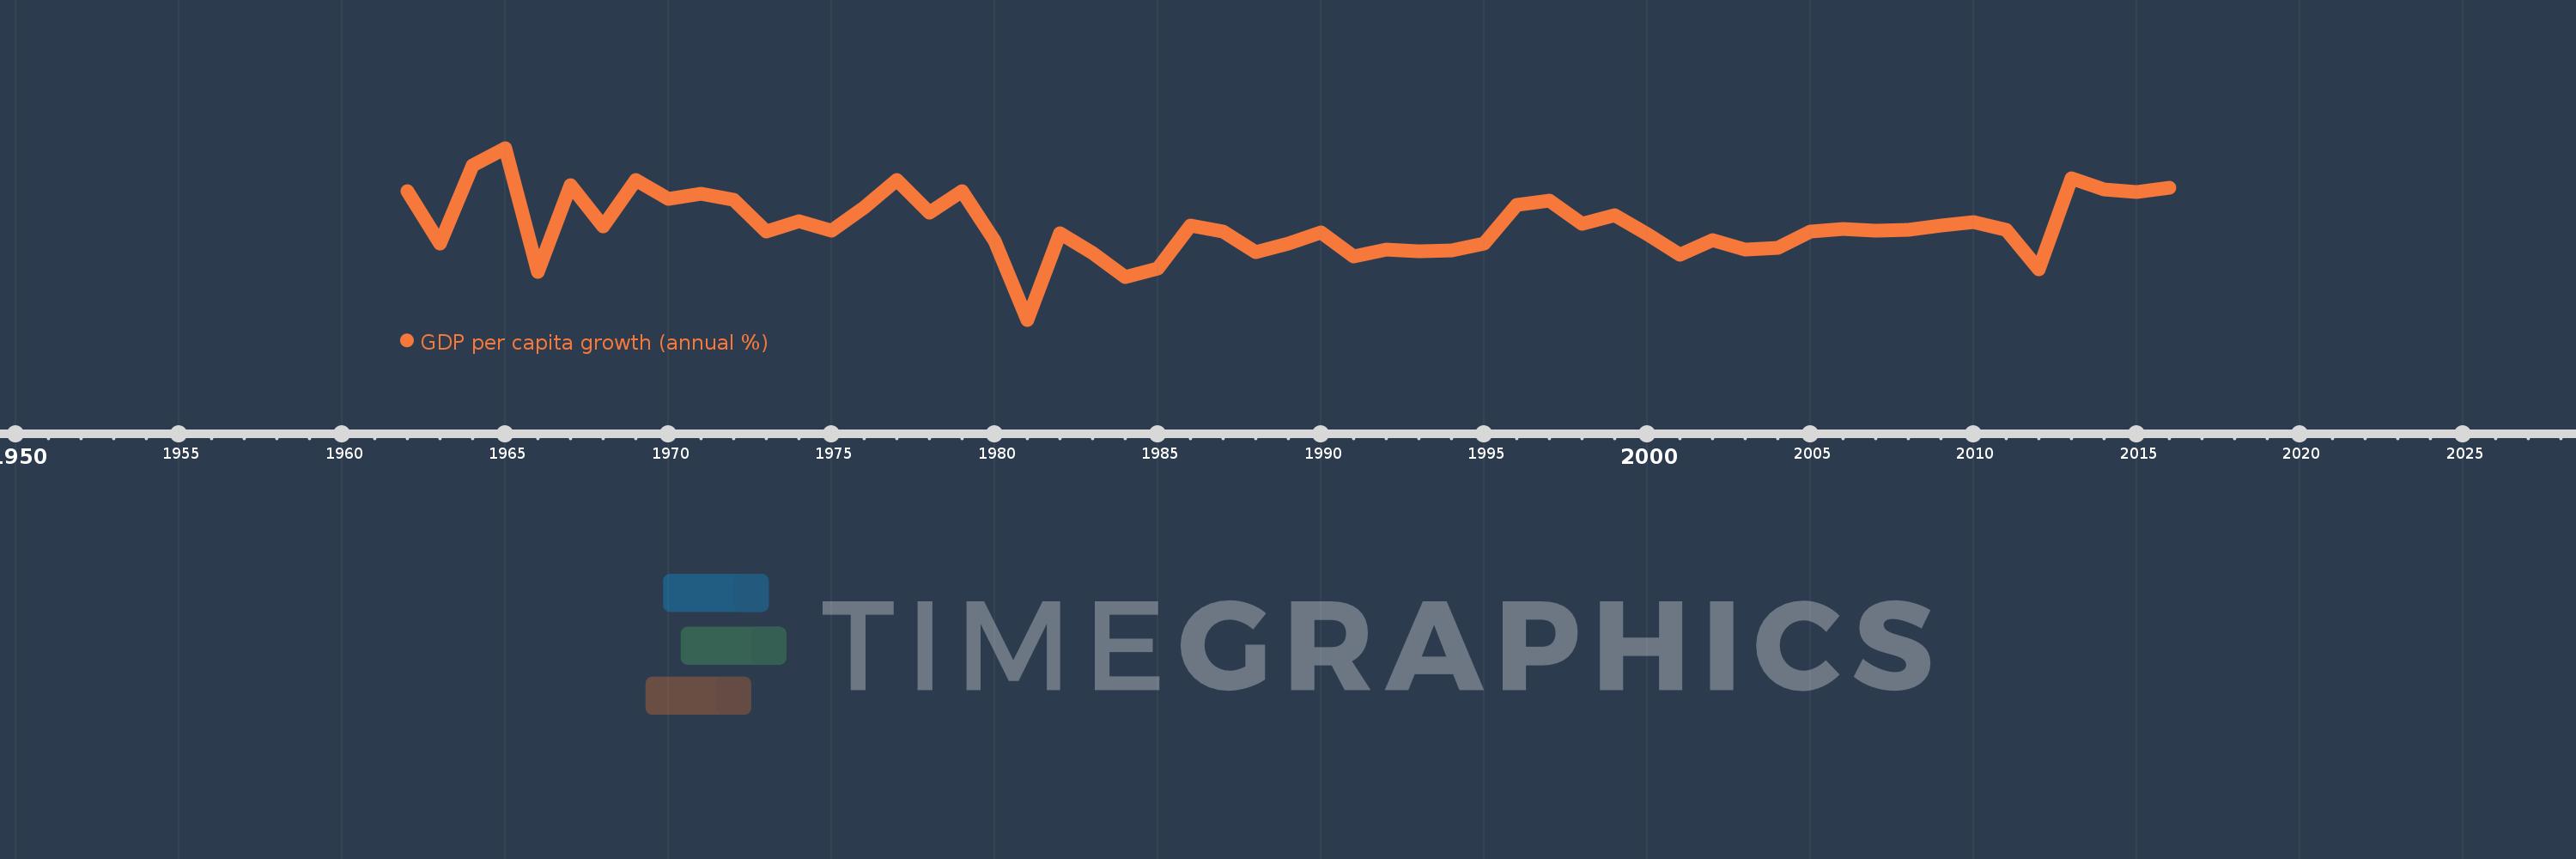
GDP per capita growth (annual %)
2016,2015,2014,2013,2012,2011,2010,2009,2008,2007,2006,2005,2004,2003,2002,2001,2000,1999,1998,1997,1996,1995,1994,1993,1992,1991,1990,1989,1988,1987,1986,1985,1984,1983,1982,1981,1980,1979,1978,1977,1976,1975,1974,1973,1972,1971,1970,1969,1968,1967,1966,1965,1964,1963,1962
Estas estadísticas en otros países:
AfghanistanAlbaniaAlgeriaAndorraAngolaAntigua and BarbudaArab WorldArgentinaArmeniaArubaAustraliaAustriaAzerbaijanBahamas, TheBahrainBangladeshBarbadosBelarusBelgiumBelizeBeninBermudaBhutanBoliviaBosnia and HerzegovinaBotswanaBrazilBrunei DarussalamBulgariaBurkina FasoBurundiCabo VerdeCambodiaCameroonCanadaCaribbean small statesCayman IslandsCentral African RepublicCentral Europe and the BalticsChadChannel IslandsChileChinaColombiaComorosCongo, Dem. Rep.Congo, Rep.Costa RicaCote d'IvoireCroatiaCubaCyprusCzech RepublicDenmarkDjiboutiDominicaDominican RepublicEarly-demographic dividendEast Asia & PacificEast Asia & Pacific (excluding high income)East Asia & Pacific (IDA & IBRD countries)EcuadorEgypt, Arab Rep.El SalvadorEquatorial GuineaEritreaEstoniaEthiopiaEuro areaEurope & Central AsiaEurope & Central Asia (excluding high income)Europe & Central Asia (IDA & IBRD countries)European UnionFijiFinlandFragile and conflict affected situationsFranceFrench PolynesiaGabonGambia, TheGeorgiaGermanyGhanaGreeceGreenlandGrenadaGuatemalaGuineaGuinea-BissauGuyanaHaitiHeavily indebted poor countries (HIPC)High incomeHondurasHong Kong SAR, ChinaHungaryIBRD onlyIcelandIDA & IBRD totalIDA blendIDA onlyIDA totalIndiaIndonesiaIran, Islamic Rep.IraqIrelandIsle of ManIsraelItalyJamaicaJapanJordanKazakhstanKenyaKiribatiKorea, Rep.KosovoKuwaitKyrgyz RepublicLao PDRLate-demographic dividendLatin America & Caribbean Latin America & Caribbean (excluding high income)Latin America & the Caribbean (IDA & IBRD countries)LatviaLeast developed countries: UN classificationLebanonLesothoLiberiaLibyaLiechtensteinLithuaniaLow & middle incomeLow incomeLower middle incomeLuxembourgMacao SAR, ChinaMacedonia, FYRMadagascarMalawiMalaysiaMaldivesMaliMaltaMarshall IslandsMauritaniaMauritiusMexicoMicronesia, Fed. Sts.Middle East & North AfricaMiddle East & North Africa (excluding high income)Middle East & North Africa (IDA & IBRD countries)Middle incomeMoldovaMonacoMongoliaMontenegroMoroccoMozambiqueMyanmarNamibiaNauruNepalNetherlandsNew CaledoniaNew ZealandNicaraguaNigerNigeriaNorth AmericaNorwayOECD membersOmanOther small statesPacific island small statesPakistanPalauPanamaPapua New GuineaParaguayPeruPhilippinesPolandPortugalPost-demographic dividendPre-demographic dividendPuerto RicoQatarRomaniaRussian FederationRwandaSamoaSan MarinoSao Tome and PrincipeSaudi ArabiaSenegalSerbiaSeychellesSierra LeoneSingaporeSlovak RepublicSloveniaSmall statesSolomon IslandsSomaliaSouth AfricaSouth AsiaSouth Asia (IDA & IBRD)South SudanSpainSri LankaSt. Kitts and NevisSt. LuciaSt. Vincent and the GrenadinesSub-Saharan Africa Sub-Saharan Africa (excluding high income)Sub-Saharan Africa (IDA & IBRD countries)SudanSurinameSwazilandSwedenSwitzerlandSyrian Arab RepublicTajikistanTanzaniaThailandTimor-LesteTogoTongaTrinidad and TobagoTunisiaTurkeyTurkmenistanTuvaluUgandaUkraineUnited Arab EmiratesUnited KingdomUnited StatesUpper middle incomeUruguayUzbekistanVanuatuVenezuela, RBVietnamVirgin Islands (U.S.)West Bank and GazaWorldYemen, Rep.ZambiaZimbabwe línea de tiempo (timeline):
En esta escala de tiempo se presenta un gráfico de 1962 y 2016 de Cote d'Ivoire. Los datos de 1961 están ausentes. El número de observaciones reales por fecha: 55.
Fuente (nombre):
Indicadores del desarrollo mundial
Fuente (organización):
World Bank national accounts data, and OECD National Accounts data files.
Categorías:
Economy & Growth
Se ha actualizado:
23 abr 2017 año
Los indicadores de los cambios de valor en los últimos años
Mínimo:
-14.762
1 ene 1981 año
Máximo:
12.972
1 ene 1965 año
A la fecha de observación
Valor
Cambio absoluto
El cambio con respecto al valor anterior
1 ene 1962 año
6.046
+6.046
0.0%
1 ene 1963 año
-2.519
-8.565
-141.67%
1 ene 1964 año
10.094
+12.614
-500.7%
1 ene 1965 año
12.972
+2.877
28.5%
1 ene 1966 año
-7.015
-19.986
-154.08%
1 ene 1967 año
7.005
+14.019
-199.86%
1 ene 1968 año
0.243
-6.762
-96.54%
1 ene 1969 año
7.779
+7.536
3.11 mil%
1 ene 1970 año
4.805
-2.974
-38.23%
1 ene 1971 año
5.512
+0.707
14.71%
1 ene 1972 año
4.556
-0.956
-17.34%
1 ene 1973 año
-0.479
-5.036
-110.52%
1 ene 1974 año
1.123
+1.602
-334.18%
1 ene 1975 año
-0.412
-1.534
-136.67%
1 ene 1976 año
3.362
+3.774
-916.94%
1 ene 1977 año
7.857
+4.495
133.67%
1 ene 1978 año
2.553
-5.304
-67.51%
1 ene 1979 año
6.043
+3.491
136.76%
1 ene 1980 año
-2.042
-8.086
-133.79%
1 ene 1981 año
-14.762
-12.72
622.86%
1 ene 1982 año
-0.86
+13.902
-94.17%
1 ene 1983 año
-3.954
-3.094
359.6%
1 ene 1984 año
-7.801
-3.847
97.3%
1 ene 1985 año
-6.544
+1.257
-16.12%
1 ene 1986 año
0.5
+7.044
-107.64%
1 ene 1987 año
-0.56
-1.06
-211.9%
1 ene 1988 año
-3.918
-3.359
600.15%
1 ene 1989 año
-2.406
+1.512
-38.59%
1 ene 1990 año
-0.625
+1.782
-74.04%
1 ene 1991 año
-4.52
-3.896
623.7%
1 ene 1992 año
-3.413
+1.107
-24.49%
1 ene 1993 año
-3.654
-0.241
7.06%
1 ene 1994 año
-3.54
+0.114
-3.12%
1 ene 1995 año
-2.469
+1.071
-30.25%
1 ene 1996 año
3.775
+6.244
-252.87%
1 ene 1997 año
4.481
+0.706
18.7%
1 ene 1998 año
0.731
-3.75
-83.69%
1 ene 1999 año
2.048
+1.317
180.2%
1 ene 2000 año
-0.96
-3.008
-146.88%
1 ene 2001 año
-4.322
-3.362
350.2%
1 ene 2002 año
-1.941
+2.381
-55.09%
1 ene 2003 año
-3.499
-1.558
80.25%
1 ene 2004 año
-3.086
+0.413
-11.81%
1 ene 2005 año
-0.537
+2.549
-82.61%
1 ene 2006 año
-0.131
+0.406
-75.58%
1 ene 2007 año
-0.426
-0.295
225.41%
1 ene 2008 año
-0.262
+0.164
-38.47%
1 ene 2009 año
0.416
+0.679
-258.62%
1 ene 2010 año
1.031
+0.615
147.82%
1 ene 2011 año
-0.247
-1.278
-123.9%
1 ene 2012 año
-6.58
-6.333
2.57 mil%
1 ene 2013 año
8.091
+14.671
-222.98%
1 ene 2014 año
6.271
-1.82
-22.49%
1 ene 2015 año
5.869
-0.403
-6.42%
1 ene 2016 año
6.545
+0.677
11.53%
Ranking de los países por los datos estadísticos actuales


Comentarios: