29
/es/
es
AIzaSyAYiBZKx7MnpbEhh9jyipgxe19OcubqV5w
April 1, 2024
201572
Morocco
MAR
true
2
1
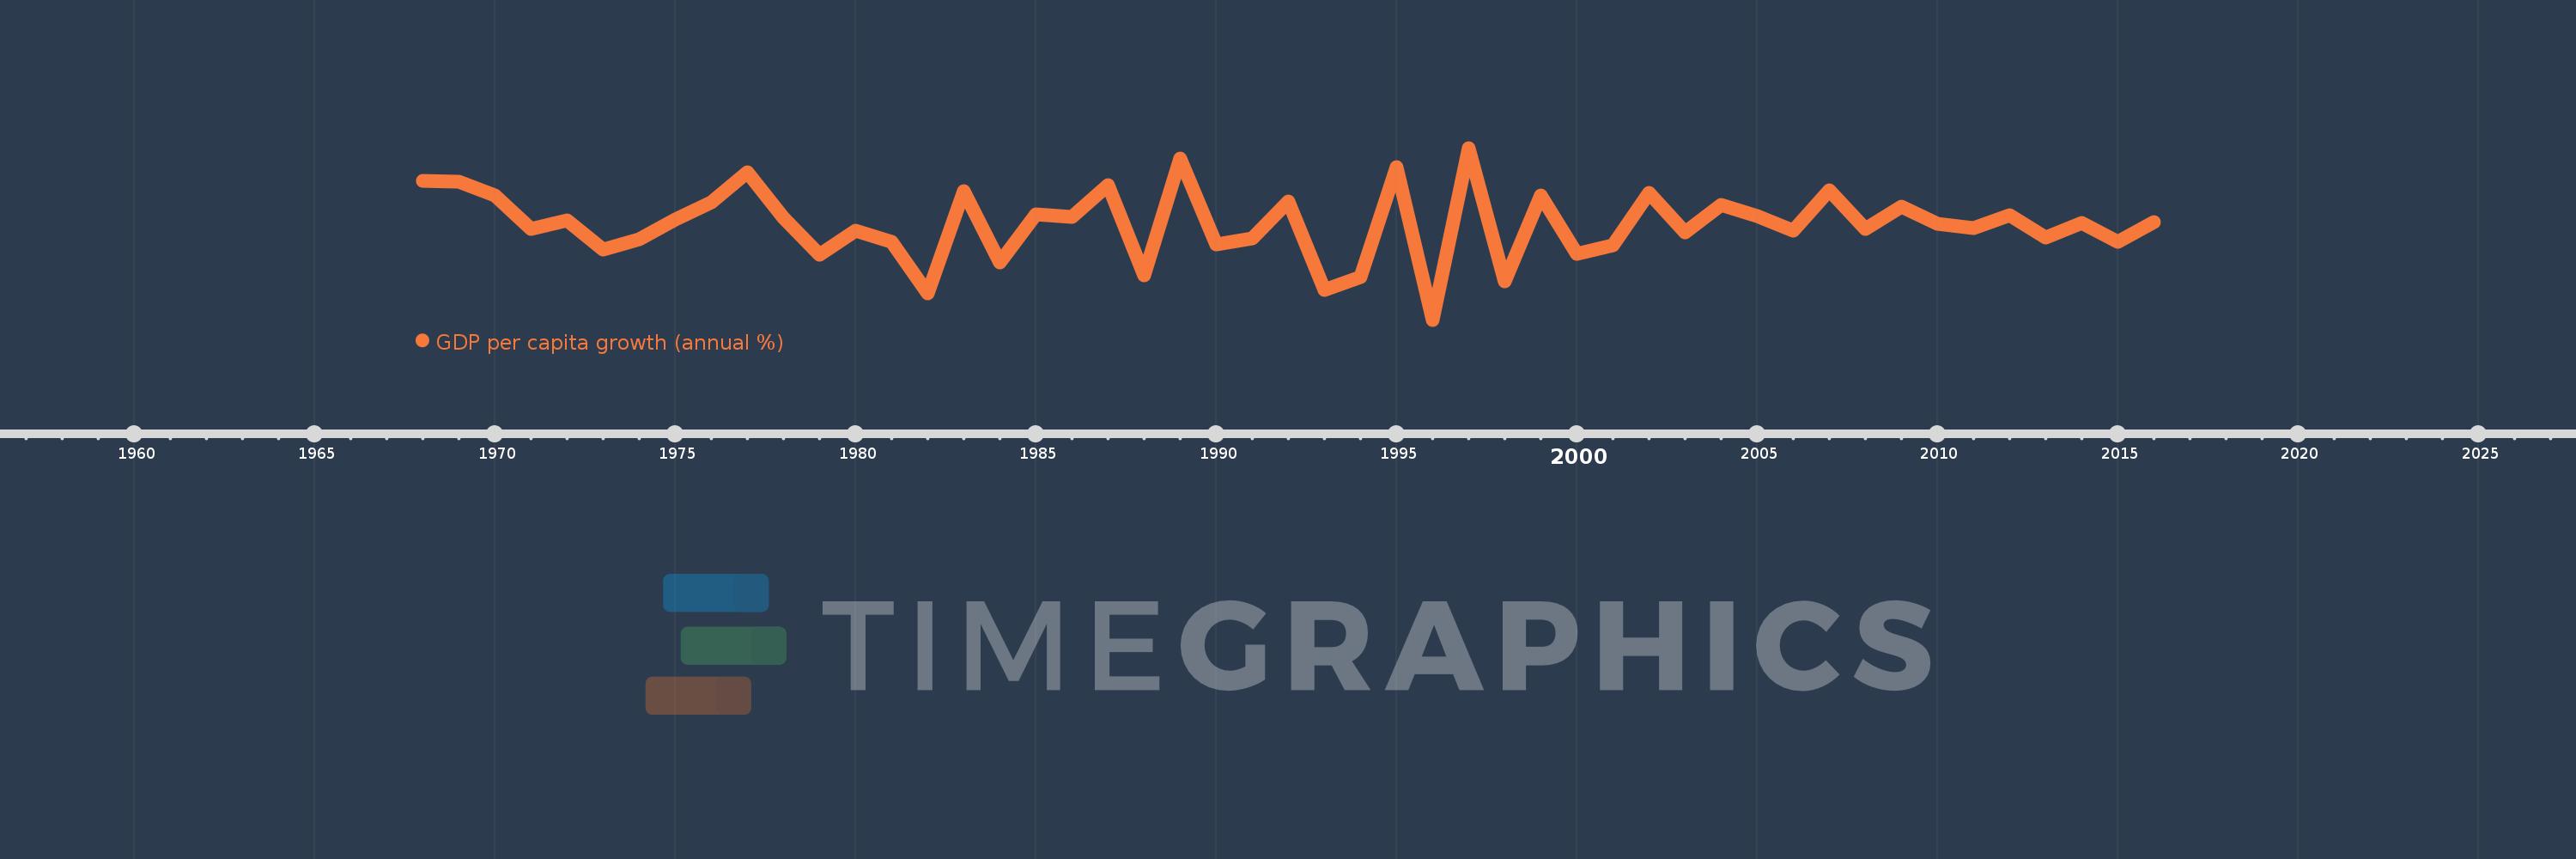
GDP per capita growth (annual %)
2016,2015,2014,2013,2012,2011,2010,2009,2008,2007,2006,2005,2004,2003,2002,2001,2000,1999,1998,1997,1996,1995,1994,1993,1992,1991,1990,1989,1988,1987,1986,1985,1984,1983,1982,1981,1980,1979,1978,1977,1976,1975,1974,1973,1972,1971,1970,1969,1968
Estas estadísticas en otros países:
AfghanistanAlbaniaAlgeriaAndorraAngolaAntigua and BarbudaArab WorldArgentinaArmeniaArubaAustraliaAustriaAzerbaijanBahamas, TheBahrainBangladeshBarbadosBelarusBelgiumBelizeBeninBermudaBhutanBoliviaBosnia and HerzegovinaBotswanaBrazilBrunei DarussalamBulgariaBurkina FasoBurundiCabo VerdeCambodiaCameroonCanadaCaribbean small statesCayman IslandsCentral African RepublicCentral Europe and the BalticsChadChannel IslandsChileChinaColombiaComorosCongo, Dem. Rep.Congo, Rep.Costa RicaCote d'IvoireCroatiaCubaCyprusCzech RepublicDenmarkDjiboutiDominicaDominican RepublicEarly-demographic dividendEast Asia & PacificEast Asia & Pacific (excluding high income)East Asia & Pacific (IDA & IBRD countries)EcuadorEgypt, Arab Rep.El SalvadorEquatorial GuineaEritreaEstoniaEthiopiaEuro areaEurope & Central AsiaEurope & Central Asia (excluding high income)Europe & Central Asia (IDA & IBRD countries)European UnionFijiFinlandFragile and conflict affected situationsFranceFrench PolynesiaGabonGambia, TheGeorgiaGermanyGhanaGreeceGreenlandGrenadaGuatemalaGuineaGuinea-BissauGuyanaHaitiHeavily indebted poor countries (HIPC)High incomeHondurasHong Kong SAR, ChinaHungaryIBRD onlyIcelandIDA & IBRD totalIDA blendIDA onlyIDA totalIndiaIndonesiaIran, Islamic Rep.IraqIrelandIsle of ManIsraelItalyJamaicaJapanJordanKazakhstanKenyaKiribatiKorea, Rep.KosovoKuwaitKyrgyz RepublicLao PDRLate-demographic dividendLatin America & Caribbean Latin America & Caribbean (excluding high income)Latin America & the Caribbean (IDA & IBRD countries)LatviaLeast developed countries: UN classificationLebanonLesothoLiberiaLibyaLiechtensteinLithuaniaLow & middle incomeLow incomeLower middle incomeLuxembourgMacao SAR, ChinaMacedonia, FYRMadagascarMalawiMalaysiaMaldivesMaliMaltaMarshall IslandsMauritaniaMauritiusMexicoMicronesia, Fed. Sts.Middle East & North AfricaMiddle East & North Africa (excluding high income)Middle East & North Africa (IDA & IBRD countries)Middle incomeMoldovaMonacoMongoliaMontenegroMoroccoMozambiqueMyanmarNamibiaNauruNepalNetherlandsNew CaledoniaNew ZealandNicaraguaNigerNigeriaNorth AmericaNorwayOECD membersOmanOther small statesPacific island small statesPakistanPalauPanamaPapua New GuineaParaguayPeruPhilippinesPolandPortugalPost-demographic dividendPre-demographic dividendPuerto RicoQatarRomaniaRussian FederationRwandaSamoaSan MarinoSao Tome and PrincipeSaudi ArabiaSenegalSerbiaSeychellesSierra LeoneSingaporeSlovak RepublicSloveniaSmall statesSolomon IslandsSomaliaSouth AfricaSouth AsiaSouth Asia (IDA & IBRD)South SudanSpainSri LankaSt. Kitts and NevisSt. LuciaSt. Vincent and the GrenadinesSub-Saharan Africa Sub-Saharan Africa (excluding high income)Sub-Saharan Africa (IDA & IBRD countries)SudanSurinameSwazilandSwedenSwitzerlandSyrian Arab RepublicTajikistanTanzaniaThailandTimor-LesteTogoTongaTrinidad and TobagoTunisiaTurkeyTurkmenistanTuvaluUgandaUkraineUnited Arab EmiratesUnited KingdomUnited StatesUpper middle incomeUruguayUzbekistanVanuatuVenezuela, RBVietnamVirgin Islands (U.S.)West Bank and GazaWorldYemen, Rep.ZambiaZimbabwe línea de tiempo (timeline):
En esta escala de tiempo se presenta un gráfico de 1968 y 2016 de Morocco. Los datos de 1967 están ausentes. El número de observaciones reales por fecha: 49.
Fuente (nombre):
Indicadores del desarrollo mundial
Fuente (organización):
World Bank national accounts data, and OECD National Accounts data files.
Categorías:
Economy & Growth
Se ha actualizado:
23 abr 2017 año
Los indicadores de los cambios de valor en los últimos años
Mínimo:
-6.861
1 ene 1996 año
Máximo:
10.747
1 ene 1997 año
A la fecha de observación
Valor
Cambio absoluto
El cambio con respecto al valor anterior
1 ene 1968 año
7.335
+7.335
0.0%
1 ene 1969 año
7.305
-0.03
-0.41%
1 ene 1970 año
5.903
-1.402
-19.19%
1 ene 1971 año
2.412
-3.491
-59.13%
1 ene 1972 año
3.353
+0.941
39.0%
1 ene 1973 año
0.319
-3.034
-90.49%
1 ene 1974 año
1.427
+1.108
347.46%
1 ene 1975 año
3.372
+1.944
136.2%
1 ene 1976 año
5.202
+1.83
54.29%
1 ene 1977 año
8.286
+3.084
59.28%
1 ene 1978 año
3.564
-4.721
-56.98%
1 ene 1979 año
-0.225
-3.789
-106.31%
1 ene 1980 año
2.25
+2.475
-1.1 mil%
1 ene 1981 año
1.126
-1.124
-49.96%
1 ene 1982 año
-4.126
-5.252
-466.52%
1 ene 1983 año
6.324
+10.451
-253.26%
1 ene 1984 año
-1.027
-7.351
-116.24%
1 ene 1985 año
3.957
+4.984
-485.27%
1 ene 1986 año
3.649
-0.308
-7.77%
1 ene 1987 año
6.948
+3.299
90.4%
1 ene 1988 año
-2.351
-9.299
-133.84%
1 ene 1989 año
9.688
+12.039
-512.08%
1 ene 1990 año
0.892
-8.796
-90.79%
1 ene 1991 año
1.49
+0.597
66.96%
1 ene 1992 año
5.263
+3.773
253.3%
1 ene 1993 año
-3.836
-9.099
-172.89%
1 ene 1994 año
-2.442
+1.394
-36.34%
1 ene 1995 año
8.782
+11.225
-459.6%
1 ene 1996 año
-6.861
-15.643
-178.12%
1 ene 1997 año
10.747
+17.608
-256.64%
1 ene 1998 año
-2.904
-13.651
-127.02%
1 ene 1999 año
5.86
+8.764
-301.81%
1 ene 2000 año
-0.144
-6.004
-102.47%
1 ene 2001 año
0.744
+0.888
-614.64%
1 ene 2002 año
6.155
+5.411
727.77%
1 ene 2003 año
2.054
-4.1
-66.62%
1 ene 2004 año
4.895
+2.84
138.26%
1 ene 2005 año
3.743
-1.152
-23.53%
1 ene 2006 año
2.232
-1.512
-40.38%
1 ene 2007 año
6.446
+4.214
188.83%
1 ene 2008 año
2.42
-4.026
-62.46%
1 ene 2009 año
4.74
+2.321
95.92%
1 ene 2010 año
3.017
-1.724
-36.37%
1 ene 2011 año
2.521
-0.496
-16.43%
1 ene 2012 año
3.853
+1.332
52.83%
1 ene 2013 año
1.582
-2.27
-58.93%
1 ene 2014 año
3.059
+1.477
93.33%
1 ene 2015 año
1.123
-1.935
-63.27%
1 ene 2016 año
3.11
+1.986
176.79%
Ranking de los países por los datos estadísticos actuales


Comentarios: