29
/es/
es
AIzaSyAYiBZKx7MnpbEhh9jyipgxe19OcubqV5w
April 1, 2024
91862
Brazil
BRA
true
2
1
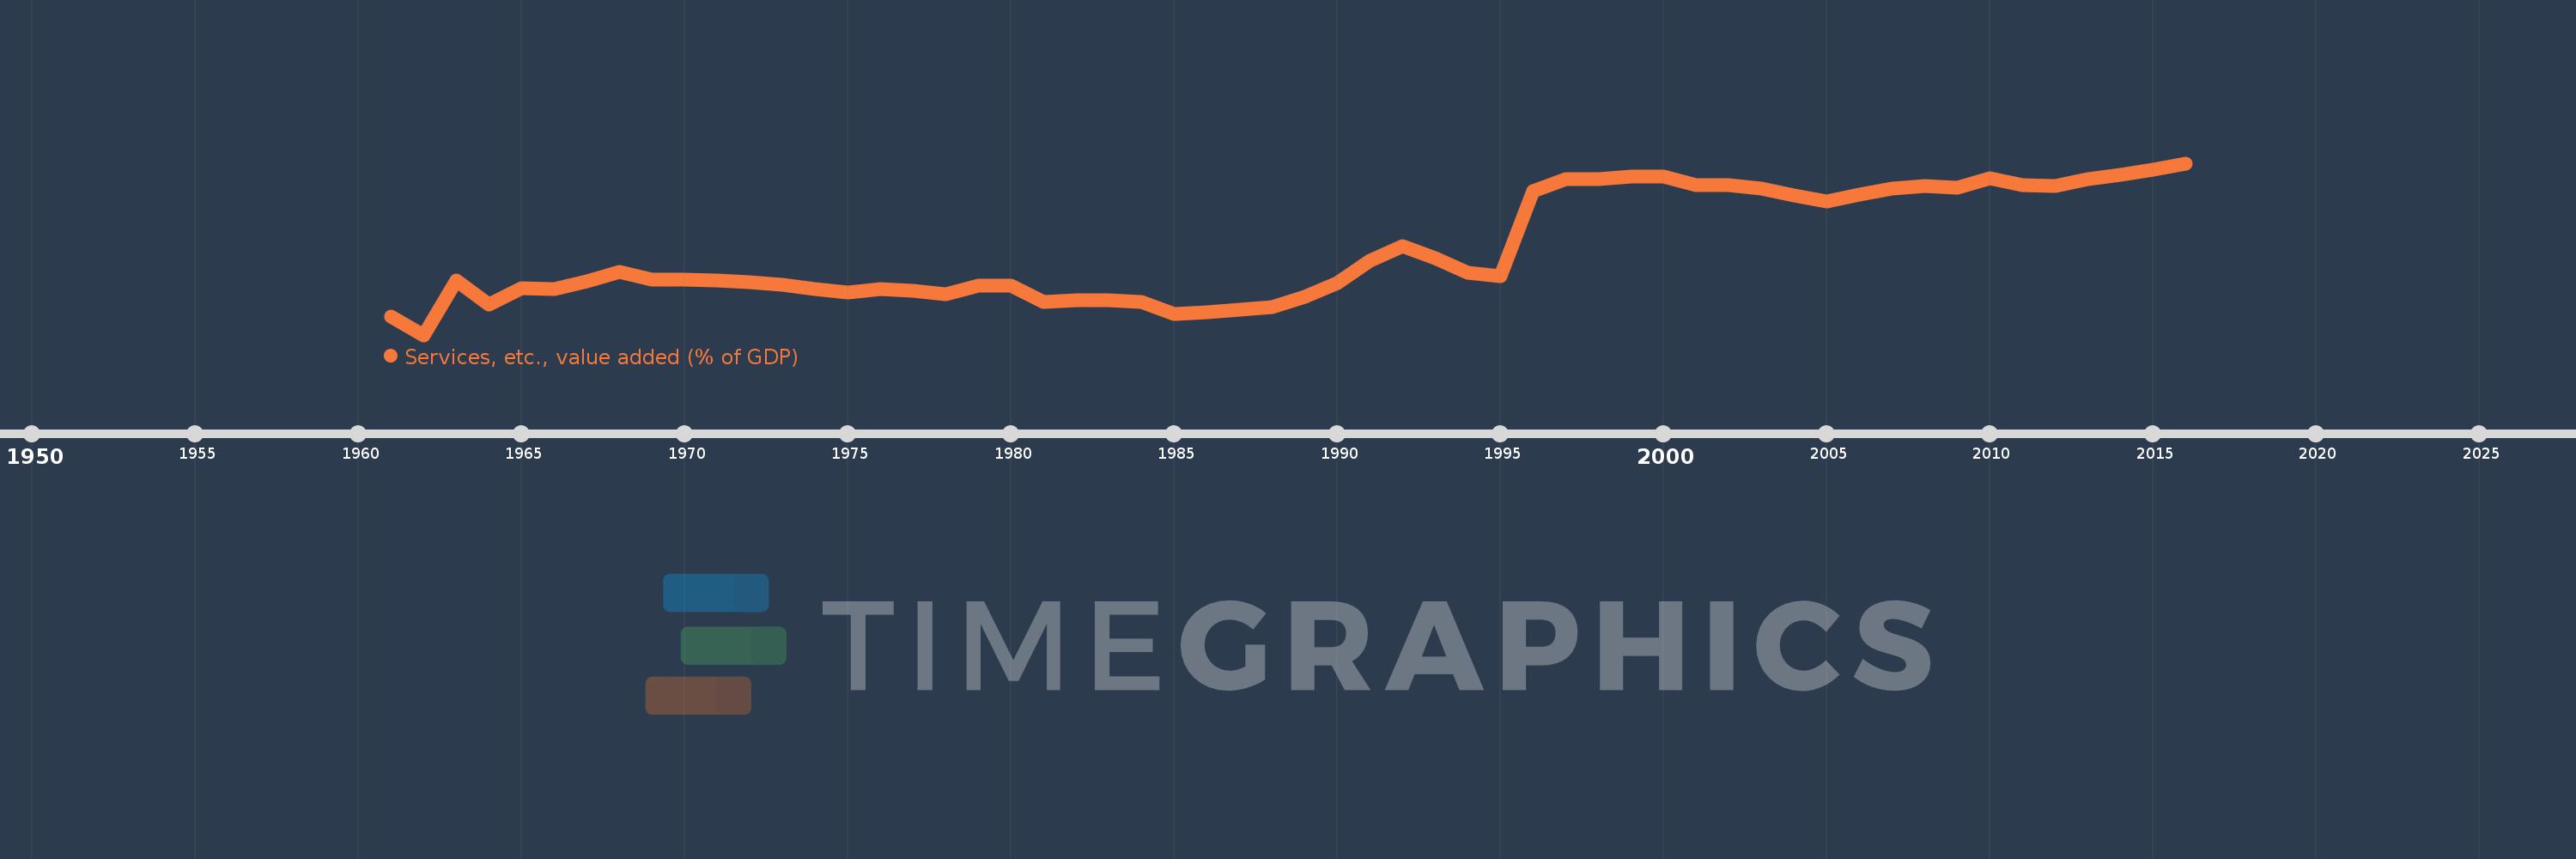
Services, etc., value added (% of GDP)
2016,2015,2014,2013,2012,2011,2010,2009,2008,2007,2006,2005,2004,2003,2002,2001,2000,1999,1998,1997,1996,1995,1994,1993,1992,1991,1990,1989,1988,1987,1986,1985,1984,1983,1982,1981,1980,1979,1978,1977,1976,1975,1974,1973,1972,1971,1970,1969,1968,1967,1966,1965,1964,1963,1962,1961
Estas estadísticas en otros países:
AfghanistanAlbaniaAlgeriaAndorraAngolaAntigua and BarbudaArab WorldArgentinaArmeniaArubaAustraliaAustriaAzerbaijanBahamas, TheBahrainBangladeshBarbadosBelarusBelgiumBelizeBeninBermudaBhutanBoliviaBosnia and HerzegovinaBotswanaBrazilBrunei DarussalamBulgariaBurkina FasoBurundiCabo VerdeCambodiaCameroonCanadaCaribbean small statesCentral African RepublicCentral Europe and the BalticsChadChileChinaColombiaComorosCongo, Dem. Rep.Congo, Rep.Costa RicaCote d'IvoireCroatiaCubaCyprusCzech RepublicDenmarkDjiboutiDominicaDominican RepublicEarly-demographic dividendEast Asia & PacificEast Asia & Pacific (excluding high income)East Asia & Pacific (IDA & IBRD countries)EcuadorEgypt, Arab Rep.El SalvadorEquatorial GuineaEritreaEstoniaEthiopiaEuro areaEurope & Central AsiaEurope & Central Asia (excluding high income)Europe & Central Asia (IDA & IBRD countries)European UnionFaroe IslandsFijiFinlandFragile and conflict affected situationsFranceGabonGambia, TheGeorgiaGermanyGhanaGreeceGrenadaGuatemalaGuineaGuinea-BissauGuyanaHeavily indebted poor countries (HIPC)High incomeHondurasHong Kong SAR, ChinaHungaryIBRD onlyIcelandIDA & IBRD totalIDA blendIDA onlyIDA totalIndiaIndonesiaIran, Islamic Rep.IrelandItalyJamaicaJapanJordanKazakhstanKenyaKiribatiKorea, Rep.KosovoKuwaitKyrgyz RepublicLao PDRLate-demographic dividendLatin America & Caribbean Latin America & Caribbean (excluding high income)Latin America & the Caribbean (IDA & IBRD countries)LatviaLeast developed countries: UN classificationLebanonLesothoLibyaLithuaniaLow & middle incomeLow incomeLower middle incomeLuxembourgMacao SAR, ChinaMacedonia, FYRMadagascarMalawiMalaysiaMaldivesMaliMaltaMarshall IslandsMauritaniaMauritiusMexicoMicronesia, Fed. Sts.Middle East & North AfricaMiddle East & North Africa (excluding high income)Middle East & North Africa (IDA & IBRD countries)Middle incomeMoldovaMongoliaMontenegroMoroccoMozambiqueMyanmarNamibiaNepalNetherlandsNew CaledoniaNew ZealandNicaraguaNigerNigeriaNorth AmericaNorwayOECD membersOmanOther small statesPacific island small statesPakistanPalauPanamaPapua New GuineaParaguayPeruPhilippinesPolandPortugalPost-demographic dividendPre-demographic dividendPuerto RicoQatarRomaniaRussian FederationRwandaSao Tome and PrincipeSaudi ArabiaSenegalSerbiaSeychellesSierra LeoneSingaporeSlovak RepublicSloveniaSmall statesSolomon IslandsSomaliaSouth AfricaSouth AsiaSouth Asia (IDA & IBRD)SpainSri LankaSt. Kitts and NevisSt. LuciaSt. Vincent and the GrenadinesSub-Saharan Africa Sub-Saharan Africa (excluding high income)Sub-Saharan Africa (IDA & IBRD countries)SudanSurinameSwazilandSwedenSwitzerlandSyrian Arab RepublicTajikistanTanzaniaThailandTimor-LesteTogoTongaTrinidad and TobagoTunisiaTurkeyTurkmenistanTuvaluUgandaUkraineUnited KingdomUnited StatesUpper middle incomeUruguayUzbekistanVanuatuVenezuela, RBVietnamWest Bank and GazaWorldYemen, Rep.ZambiaZimbabwe línea de tiempo (timeline):
En esta escala de tiempo se presenta un gráfico de 1961 y 2016 de Brazil. Los datos de 1960 están ausentes. El número de observaciones reales por fecha: 56.
Fuente (nombre):
Indicadores del desarrollo mundial
Fuente (organización):
World Bank national accounts data, and OECD National Accounts data files.
Categorías:
Economy & Growth
Se ha actualizado:
23 abr 2017 año
Los indicadores de los cambios de valor en los últimos años
Mínimo:
38.758
1 ene 1962 año
Máximo:
72.049
1 ene 2016 año
A la fecha de observación
Valor
Cambio absoluto
El cambio con respecto al valor anterior
1 ene 1961 año
42.341
+42.341
0.0%
1 ene 1962 año
38.758
-3.582
-8.46%
1 ene 1963 año
49.32
+10.562
27.25%
1 ene 1964 año
44.605
-4.716
-9.56%
1 ene 1965 año
47.761
+3.157
7.08%
1 ene 1966 año
47.711
-0.05
-0.11%
1 ene 1967 año
49.183
+1.472
3.09%
1 ene 1968 año
51.041
+1.858
3.78%
1 ene 1969 año
49.49
-1.551
-3.04%
1 ene 1970 año
49.423
-0.067
-0.14%
1 ene 1971 año
49.354
-0.068
-0.14%
1 ene 1972 año
48.937
-0.417
-0.85%
1 ene 1973 año
48.568
-0.369
-0.75%
1 ene 1974 año
47.638
-0.93
-1.91%
1 ene 1975 año
47.017
-0.621
-1.3%
1 ene 1976 año
47.727
+0.71
1.51%
1 ene 1977 año
47.283
-0.444
-0.93%
1 ene 1978 año
46.68
-0.603
-1.28%
1 ene 1979 año
48.255
+1.574
3.37%
1 ene 1980 año
48.347
+0.092
0.19%
1 ene 1981 año
45.161
-3.186
-6.59%
1 ene 1982 año
45.545
+0.384
0.85%
1 ene 1983 año
45.444
-0.101
-0.22%
1 ene 1984 año
45.11
-0.334
-0.74%
1 ene 1985 año
42.824
-2.286
-5.07%
1 ene 1986 año
43.146
+0.322
0.75%
1 ene 1987 año
43.682
+0.536
1.24%
1 ene 1988 año
44.11
+0.428
0.98%
1 ene 1989 año
46.238
+2.128
4.82%
1 ene 1990 año
48.81
+2.572
5.56%
1 ene 1991 año
53.21
+4.4
9.01%
1 ene 1992 año
56.05
+2.84
5.34%
1 ene 1993 año
53.58
-2.47
-4.41%
1 ene 1994 año
50.83
-2.75
-5.13%
1 ene 1995 año
50.147
-0.683
-1.34%
1 ene 1996 año
66.703
+16.556
33.01%
1 ene 1997 año
68.993
+2.29
3.43%
1 ene 1998 año
68.96
-0.033
-0.05%
1 ene 1999 año
69.463
+0.503
0.73%
1 ene 2000 año
69.522
+0.059
0.09%
1 ene 2001 año
67.728
-1.795
-2.58%
1 ene 2002 año
67.775
+0.048
0.07%
1 ene 2003 año
67.216
-0.559
-0.82%
1 ene 2004 año
65.832
-1.385
-2.06%
1 ene 2005 año
64.694
-1.138
-1.73%
1 ene 2006 año
66.05
+1.355
2.1%
1 ene 2007 año
67.18
+1.13
1.71%
1 ene 2008 año
67.699
+0.519
0.77%
1 ene 2009 año
67.258
-0.441
-0.65%
1 ene 2010 año
69.175
+1.917
2.85%
1 ene 2011 año
67.783
-1.393
-2.01%
1 ene 2012 año
67.698
-0.085
-0.13%
1 ene 2013 año
69.024
+1.326
1.96%
1 ene 2014 año
69.768
+0.744
1.08%
1 ene 2015 año
70.809
+1.041
1.49%
1 ene 2016 año
72.049
+1.24
1.75%
Ranking de los países por los datos estadísticos actuales


Comentarios: