29
/es/
es
AIzaSyAYiBZKx7MnpbEhh9jyipgxe19OcubqV5w
April 1, 2024
86581
Bhutan
BTN
true
2
1
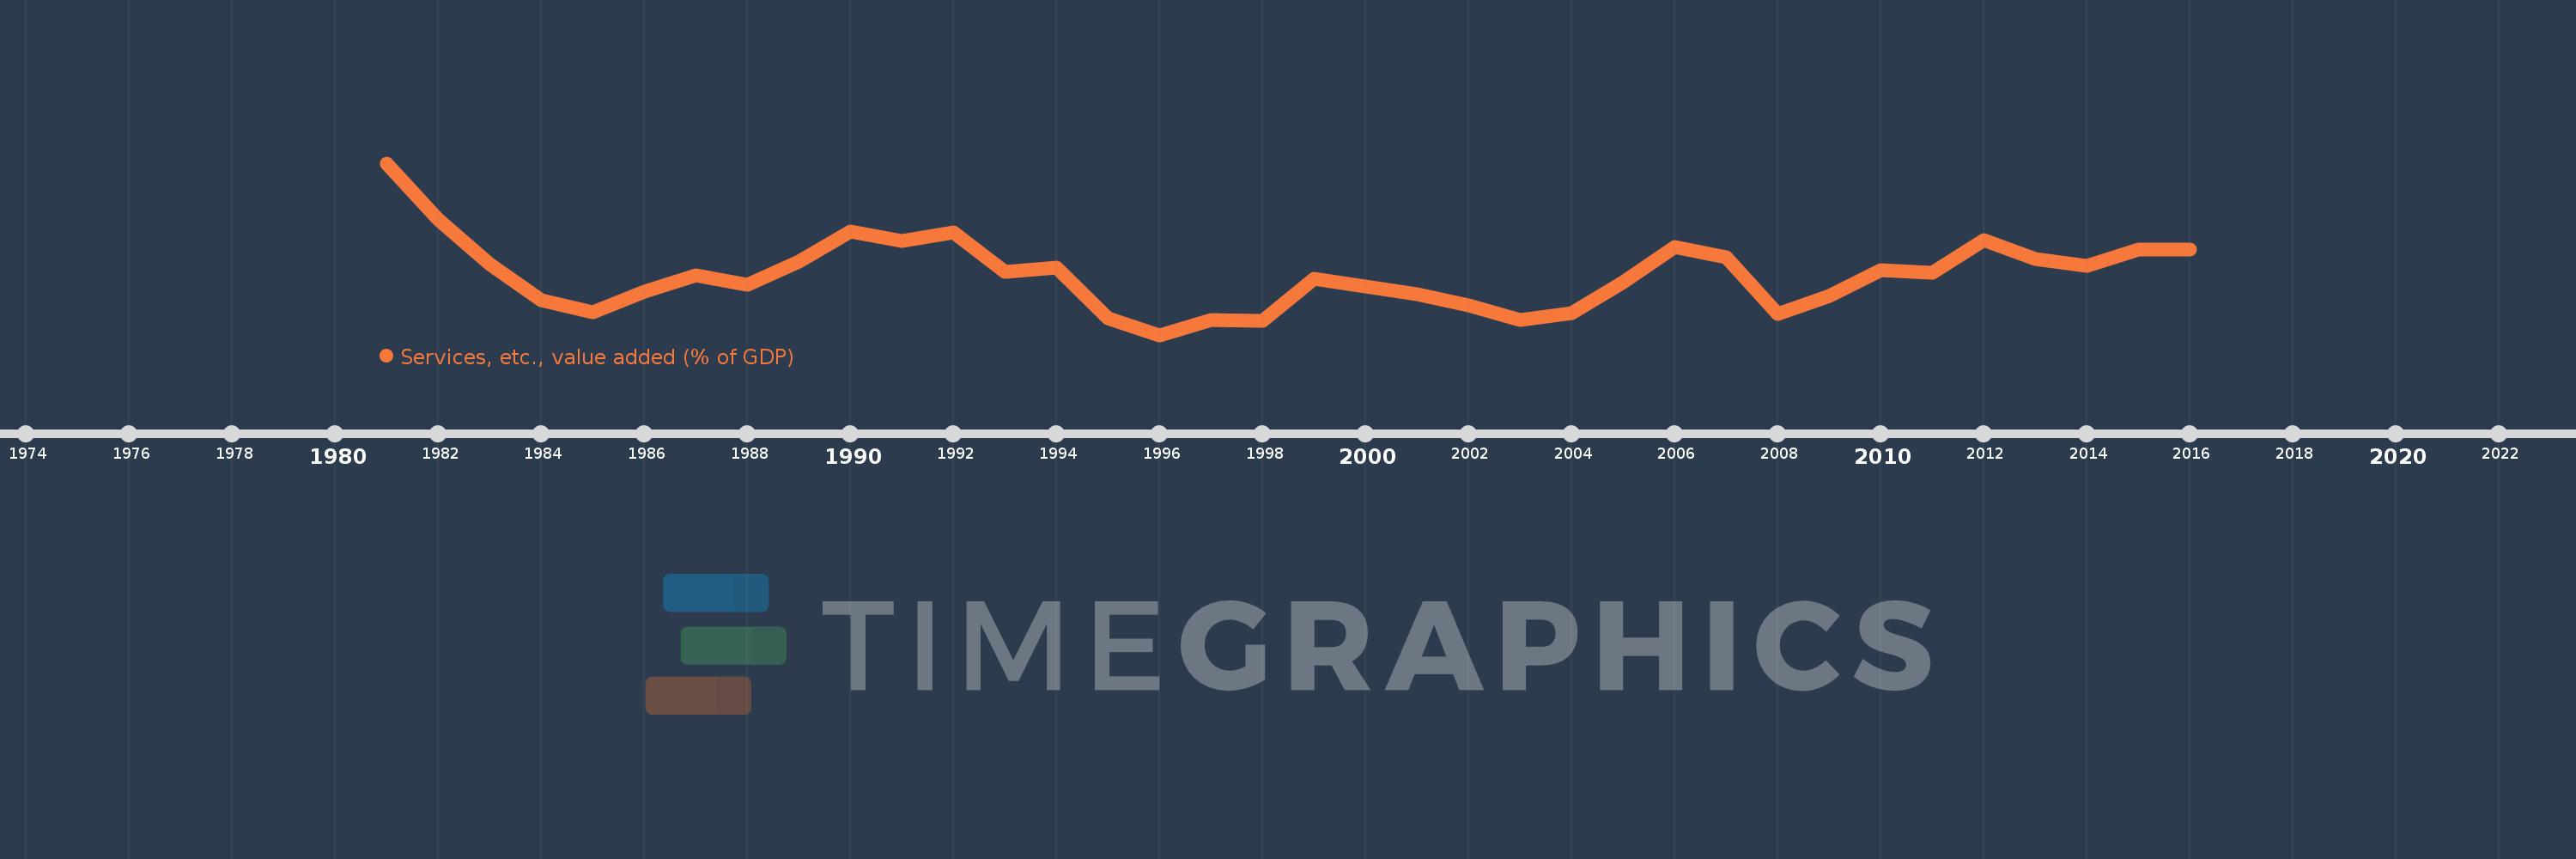
Services, etc., value added (% of GDP)
2016,2015,2014,2013,2012,2011,2010,2009,2008,2007,2006,2005,2004,2003,2002,2001,2000,1999,1998,1997,1996,1995,1994,1993,1992,1991,1990,1989,1988,1987,1986,1985,1984,1983,1982,1981
Estas estadísticas en otros países:
AfghanistanAlbaniaAlgeriaAndorraAngolaAntigua and BarbudaArab WorldArgentinaArmeniaArubaAustraliaAustriaAzerbaijanBahamas, TheBahrainBangladeshBarbadosBelarusBelgiumBelizeBeninBermudaBhutanBoliviaBosnia and HerzegovinaBotswanaBrazilBrunei DarussalamBulgariaBurkina FasoBurundiCabo VerdeCambodiaCameroonCanadaCaribbean small statesCentral African RepublicCentral Europe and the BalticsChadChileChinaColombiaComorosCongo, Dem. Rep.Congo, Rep.Costa RicaCote d'IvoireCroatiaCubaCyprusCzech RepublicDenmarkDjiboutiDominicaDominican RepublicEarly-demographic dividendEast Asia & PacificEast Asia & Pacific (excluding high income)East Asia & Pacific (IDA & IBRD countries)EcuadorEgypt, Arab Rep.El SalvadorEquatorial GuineaEritreaEstoniaEthiopiaEuro areaEurope & Central AsiaEurope & Central Asia (excluding high income)Europe & Central Asia (IDA & IBRD countries)European UnionFaroe IslandsFijiFinlandFragile and conflict affected situationsFranceGabonGambia, TheGeorgiaGermanyGhanaGreeceGrenadaGuatemalaGuineaGuinea-BissauGuyanaHeavily indebted poor countries (HIPC)High incomeHondurasHong Kong SAR, ChinaHungaryIBRD onlyIcelandIDA & IBRD totalIDA blendIDA onlyIDA totalIndiaIndonesiaIran, Islamic Rep.IrelandItalyJamaicaJapanJordanKazakhstanKenyaKiribatiKorea, Rep.KosovoKuwaitKyrgyz RepublicLao PDRLate-demographic dividendLatin America & Caribbean Latin America & Caribbean (excluding high income)Latin America & the Caribbean (IDA & IBRD countries)LatviaLeast developed countries: UN classificationLebanonLesothoLibyaLithuaniaLow & middle incomeLow incomeLower middle incomeLuxembourgMacao SAR, ChinaMacedonia, FYRMadagascarMalawiMalaysiaMaldivesMaliMaltaMarshall IslandsMauritaniaMauritiusMexicoMicronesia, Fed. Sts.Middle East & North AfricaMiddle East & North Africa (excluding high income)Middle East & North Africa (IDA & IBRD countries)Middle incomeMoldovaMongoliaMontenegroMoroccoMozambiqueMyanmarNamibiaNepalNetherlandsNew CaledoniaNew ZealandNicaraguaNigerNigeriaNorth AmericaNorwayOECD membersOmanOther small statesPacific island small statesPakistanPalauPanamaPapua New GuineaParaguayPeruPhilippinesPolandPortugalPost-demographic dividendPre-demographic dividendPuerto RicoQatarRomaniaRussian FederationRwandaSao Tome and PrincipeSaudi ArabiaSenegalSerbiaSeychellesSierra LeoneSingaporeSlovak RepublicSloveniaSmall statesSolomon IslandsSomaliaSouth AfricaSouth AsiaSouth Asia (IDA & IBRD)SpainSri LankaSt. Kitts and NevisSt. LuciaSt. Vincent and the GrenadinesSub-Saharan Africa Sub-Saharan Africa (excluding high income)Sub-Saharan Africa (IDA & IBRD countries)SudanSurinameSwazilandSwedenSwitzerlandSyrian Arab RepublicTajikistanTanzaniaThailandTimor-LesteTogoTongaTrinidad and TobagoTunisiaTurkeyTurkmenistanTuvaluUgandaUkraineUnited KingdomUnited StatesUpper middle incomeUruguayUzbekistanVanuatuVenezuela, RBVietnamWest Bank and GazaWorldYemen, Rep.ZambiaZimbabwe línea de tiempo (timeline):
En esta escala de tiempo se presenta un gráfico de 1981 y 2016 de Bhutan. Los datos de 1980 están ausentes. El número de observaciones reales por fecha: 36.
Fuente (nombre):
Indicadores del desarrollo mundial
Fuente (organización):
World Bank national accounts data, and OECD National Accounts data files.
Categorías:
Economy & Growth
Se ha actualizado:
23 abr 2017 año
Los indicadores de los cambios de valor en los últimos años
Mínimo:
34.132
1 ene 1996 año
Máximo:
44.615
1 ene 1981 año
A la fecha de observación
Valor
Cambio absoluto
El cambio con respecto al valor anterior
1 ene 1981 año
44.615
+44.615
0.0%
1 ene 1982 año
41.173
-3.442
-7.71%
1 ene 1983 año
38.467
-2.706
-6.57%
1 ene 1984 año
36.28
-2.187
-5.68%
1 ene 1985 año
35.539
-0.742
-2.05%
1 ene 1986 año
36.755
+1.216
3.42%
1 ene 1987 año
37.778
+1.023
2.78%
1 ene 1988 año
37.201
-0.577
-1.53%
1 ene 1989 año
38.613
+1.412
3.8%
1 ene 1990 año
40.44
+1.826
4.73%
1 ene 1991 año
39.869
-0.571
-1.41%
1 ene 1992 año
40.396
+0.527
1.32%
1 ene 1993 año
37.97
-2.426
-6.01%
1 ene 1994 año
38.245
+0.275
0.72%
1 ene 1995 año
35.175
-3.07
-8.03%
1 ene 1996 año
34.132
-1.043
-2.97%
1 ene 1997 año
35.073
+0.941
2.76%
1 ene 1998 año
35.009
-0.064
-0.18%
1 ene 1999 año
37.566
+2.557
7.3%
1 ene 2000 año
37.083
-0.483
-1.29%
1 ene 2001 año
36.62
-0.463
-1.25%
1 ene 2002 año
35.961
-0.659
-1.8%
1 ene 2003 año
35.059
-0.902
-2.51%
1 ene 2004 año
35.447
+0.388
1.11%
1 ene 2005 año
37.334
+1.887
5.32%
1 ene 2006 año
39.528
+2.194
5.88%
1 ene 2007 año
38.879
-0.649
-1.64%
1 ene 2008 año
35.392
-3.487
-8.97%
1 ene 2009 año
36.522
+1.129
3.19%
1 ene 2010 año
38.083
+1.561
4.27%
1 ene 2011 año
37.945
-0.138
-0.36%
1 ene 2012 año
39.918
+1.973
5.2%
1 ene 2013 año
38.765
-1.153
-2.89%
1 ene 2014 año
38.33
-0.435
-1.12%
1 ene 2015 año
39.371
+1.041
2.72%
1 ene 2016 año
39.362
-0.009
-0.02%
Ranking de los países por los datos estadísticos actuales


Comentarios: