29
/es/
es
AIzaSyAYiBZKx7MnpbEhh9jyipgxe19OcubqV5w
April 1, 2024
147447
Guinea-Bissau
GNB
true
2
1
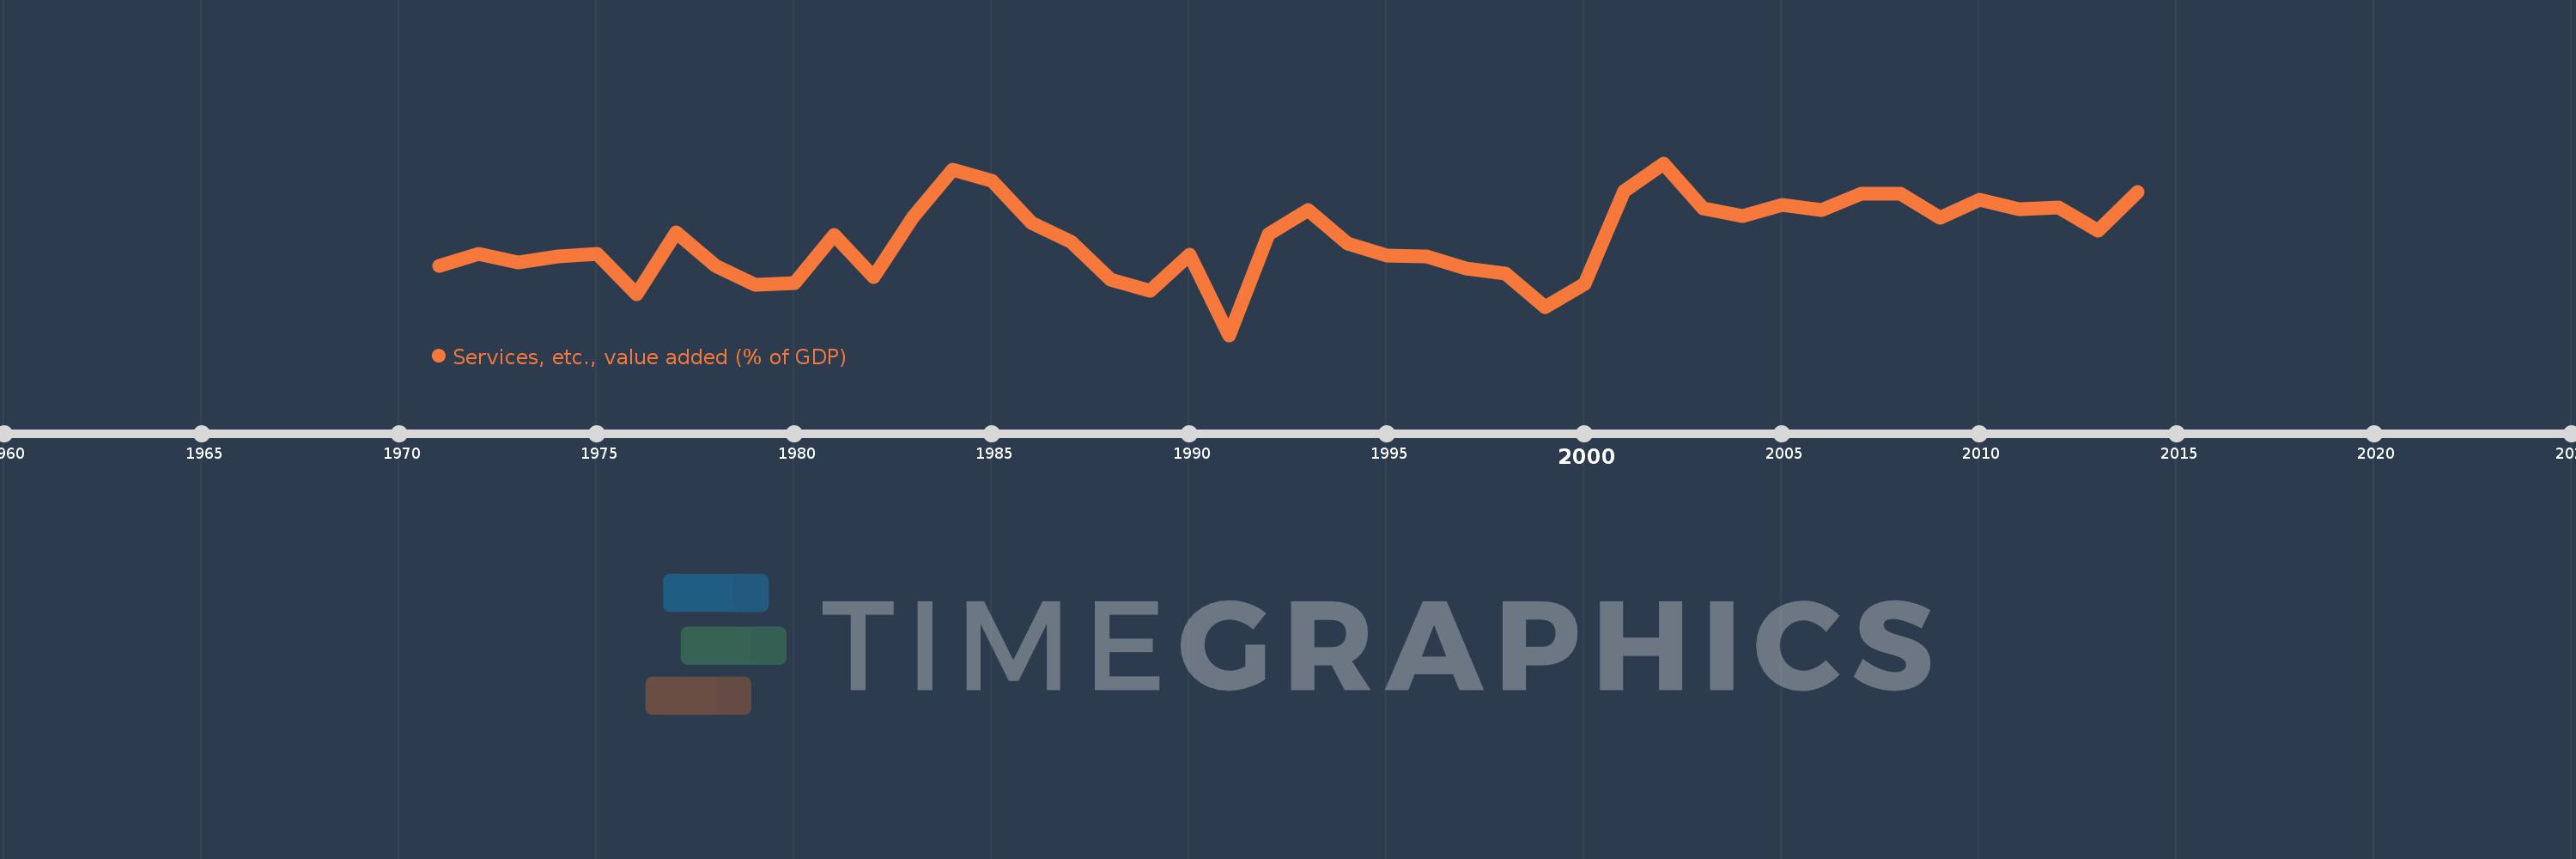
Services, etc., value added (% of GDP)
2014,2013,2012,2011,2010,2009,2008,2007,2006,2005,2004,2003,2002,2001,2000,1999,1998,1997,1996,1995,1994,1993,1992,1991,1990,1989,1988,1987,1986,1985,1984,1983,1982,1981,1980,1979,1978,1977,1976,1975,1974,1973,1972,1971
Estas estadísticas en otros países:
AfghanistanAlbaniaAlgeriaAndorraAngolaAntigua and BarbudaArab WorldArgentinaArmeniaArubaAustraliaAustriaAzerbaijanBahamas, TheBahrainBangladeshBarbadosBelarusBelgiumBelizeBeninBermudaBhutanBoliviaBosnia and HerzegovinaBotswanaBrazilBrunei DarussalamBulgariaBurkina FasoBurundiCabo VerdeCambodiaCameroonCanadaCaribbean small statesCentral African RepublicCentral Europe and the BalticsChadChileChinaColombiaComorosCongo, Dem. Rep.Congo, Rep.Costa RicaCote d'IvoireCroatiaCubaCyprusCzech RepublicDenmarkDjiboutiDominicaDominican RepublicEarly-demographic dividendEast Asia & PacificEast Asia & Pacific (excluding high income)East Asia & Pacific (IDA & IBRD countries)EcuadorEgypt, Arab Rep.El SalvadorEquatorial GuineaEritreaEstoniaEthiopiaEuro areaEurope & Central AsiaEurope & Central Asia (excluding high income)Europe & Central Asia (IDA & IBRD countries)European UnionFaroe IslandsFijiFinlandFragile and conflict affected situationsFranceGabonGambia, TheGeorgiaGermanyGhanaGreeceGrenadaGuatemalaGuineaGuinea-BissauGuyanaHeavily indebted poor countries (HIPC)High incomeHondurasHong Kong SAR, ChinaHungaryIBRD onlyIcelandIDA & IBRD totalIDA blendIDA onlyIDA totalIndiaIndonesiaIran, Islamic Rep.IrelandItalyJamaicaJapanJordanKazakhstanKenyaKiribatiKorea, Rep.KosovoKuwaitKyrgyz RepublicLao PDRLate-demographic dividendLatin America & Caribbean Latin America & Caribbean (excluding high income)Latin America & the Caribbean (IDA & IBRD countries)LatviaLeast developed countries: UN classificationLebanonLesothoLibyaLithuaniaLow & middle incomeLow incomeLower middle incomeLuxembourgMacao SAR, ChinaMacedonia, FYRMadagascarMalawiMalaysiaMaldivesMaliMaltaMarshall IslandsMauritaniaMauritiusMexicoMicronesia, Fed. Sts.Middle East & North AfricaMiddle East & North Africa (excluding high income)Middle East & North Africa (IDA & IBRD countries)Middle incomeMoldovaMongoliaMontenegroMoroccoMozambiqueMyanmarNamibiaNepalNetherlandsNew CaledoniaNew ZealandNicaraguaNigerNigeriaNorth AmericaNorwayOECD membersOmanOther small statesPacific island small statesPakistanPalauPanamaPapua New GuineaParaguayPeruPhilippinesPolandPortugalPost-demographic dividendPre-demographic dividendPuerto RicoQatarRomaniaRussian FederationRwandaSao Tome and PrincipeSaudi ArabiaSenegalSerbiaSeychellesSierra LeoneSingaporeSlovak RepublicSloveniaSmall statesSolomon IslandsSomaliaSouth AfricaSouth AsiaSouth Asia (IDA & IBRD)SpainSri LankaSt. Kitts and NevisSt. LuciaSt. Vincent and the GrenadinesSub-Saharan Africa Sub-Saharan Africa (excluding high income)Sub-Saharan Africa (IDA & IBRD countries)SudanSurinameSwazilandSwedenSwitzerlandSyrian Arab RepublicTajikistanTanzaniaThailandTimor-LesteTogoTongaTrinidad and TobagoTunisiaTurkeyTurkmenistanTuvaluUgandaUkraineUnited KingdomUnited StatesUpper middle incomeUruguayUzbekistanVanuatuVenezuela, RBVietnamWest Bank and GazaWorldYemen, Rep.ZambiaZimbabwe línea de tiempo (timeline):
En esta escala de tiempo se presenta un gráfico de 1971 y 2014 de Guinea-Bissau. Los datos de 1970 están ausentes. El número de observaciones reales por fecha: 44.
Fuente (nombre):
Indicadores del desarrollo mundial
Fuente (organización):
World Bank national accounts data, and OECD National Accounts data files.
Categorías:
Economy & Growth
Se ha actualizado:
23 abr 2017 año
Los indicadores de los cambios de valor en los últimos años
Mínimo:
20.596
1 ene 1991 año
Máximo:
47.091
1 ene 2002 año
A la fecha de observación
Valor
Cambio absoluto
El cambio con respecto al valor anterior
1 ene 1971 año
31.299
+31.299
0.0%
1 ene 1972 año
33.071
+1.773
5.66%
1 ene 1973 año
31.757
-1.315
-3.98%
1 ene 1974 año
32.724
+0.967
3.05%
1 ene 1975 año
33.128
+0.405
1.24%
1 ene 1976 año
26.866
-6.262
-18.9%
1 ene 1977 año
36.384
+9.518
35.43%
1 ene 1978 año
31.207
-5.177
-14.23%
1 ene 1979 año
28.4
-2.807
-8.99%
1 ene 1980 año
28.549
+0.149
0.52%
1 ene 1981 año
36.058
+7.509
26.3%
1 ene 1982 año
29.509
-6.548
-18.16%
1 ene 1983 año
38.836
+9.327
31.61%
1 ene 1984 año
46.112
+7.276
18.74%
1 ene 1985 año
44.311
-1.801
-3.91%
1 ene 1986 año
37.872
-6.439
-14.53%
1 ene 1987 año
34.957
-2.915
-7.7%
1 ene 1988 año
29.205
-5.752
-16.45%
1 ene 1989 año
27.365
-1.84
-6.3%
1 ene 1990 año
32.963
+5.598
20.46%
1 ene 1991 año
20.596
-12.367
-37.52%
1 ene 1992 año
36.129
+15.533
75.42%
1 ene 1993 año
39.913
+3.785
10.48%
1 ene 1994 año
34.666
-5.247
-13.15%
1 ene 1995 año
32.847
-1.819
-5.25%
1 ene 1996 año
32.746
-0.101
-0.31%
1 ene 1997 año
30.819
-1.926
-5.88%
1 ene 1998 año
30.099
-0.721
-2.34%
1 ene 1999 año
24.942
-5.157
-17.13%
1 ene 2000 año
28.42
+3.478
13.94%
1 ene 2001 año
42.811
+14.392
50.64%
1 ene 2002 año
47.091
+4.28
10.0%
1 ene 2003 año
40.098
-6.994
-14.85%
1 ene 2004 año
39.009
-1.089
-2.71%
1 ene 2005 año
40.619
+1.61
4.13%
1 ene 2006 año
39.879
-0.741
-1.82%
1 ene 2007 año
42.377
+2.499
6.27%
1 ene 2008 año
42.339
-0.038
-0.09%
1 ene 2009 año
38.655
-3.684
-8.7%
1 ene 2010 año
41.445
+2.789
7.22%
1 ene 2011 año
39.955
-1.49
-3.6%
1 ene 2012 año
40.334
+0.379
0.95%
1 ene 2013 año
36.689
-3.645
-9.04%
1 ene 2014 año
42.653
+5.964
16.25%
Ranking de los países por los datos estadísticos actuales


Comentarios: