29
/es/
es
AIzaSyAYiBZKx7MnpbEhh9jyipgxe19OcubqV5w
April 1, 2024
44664
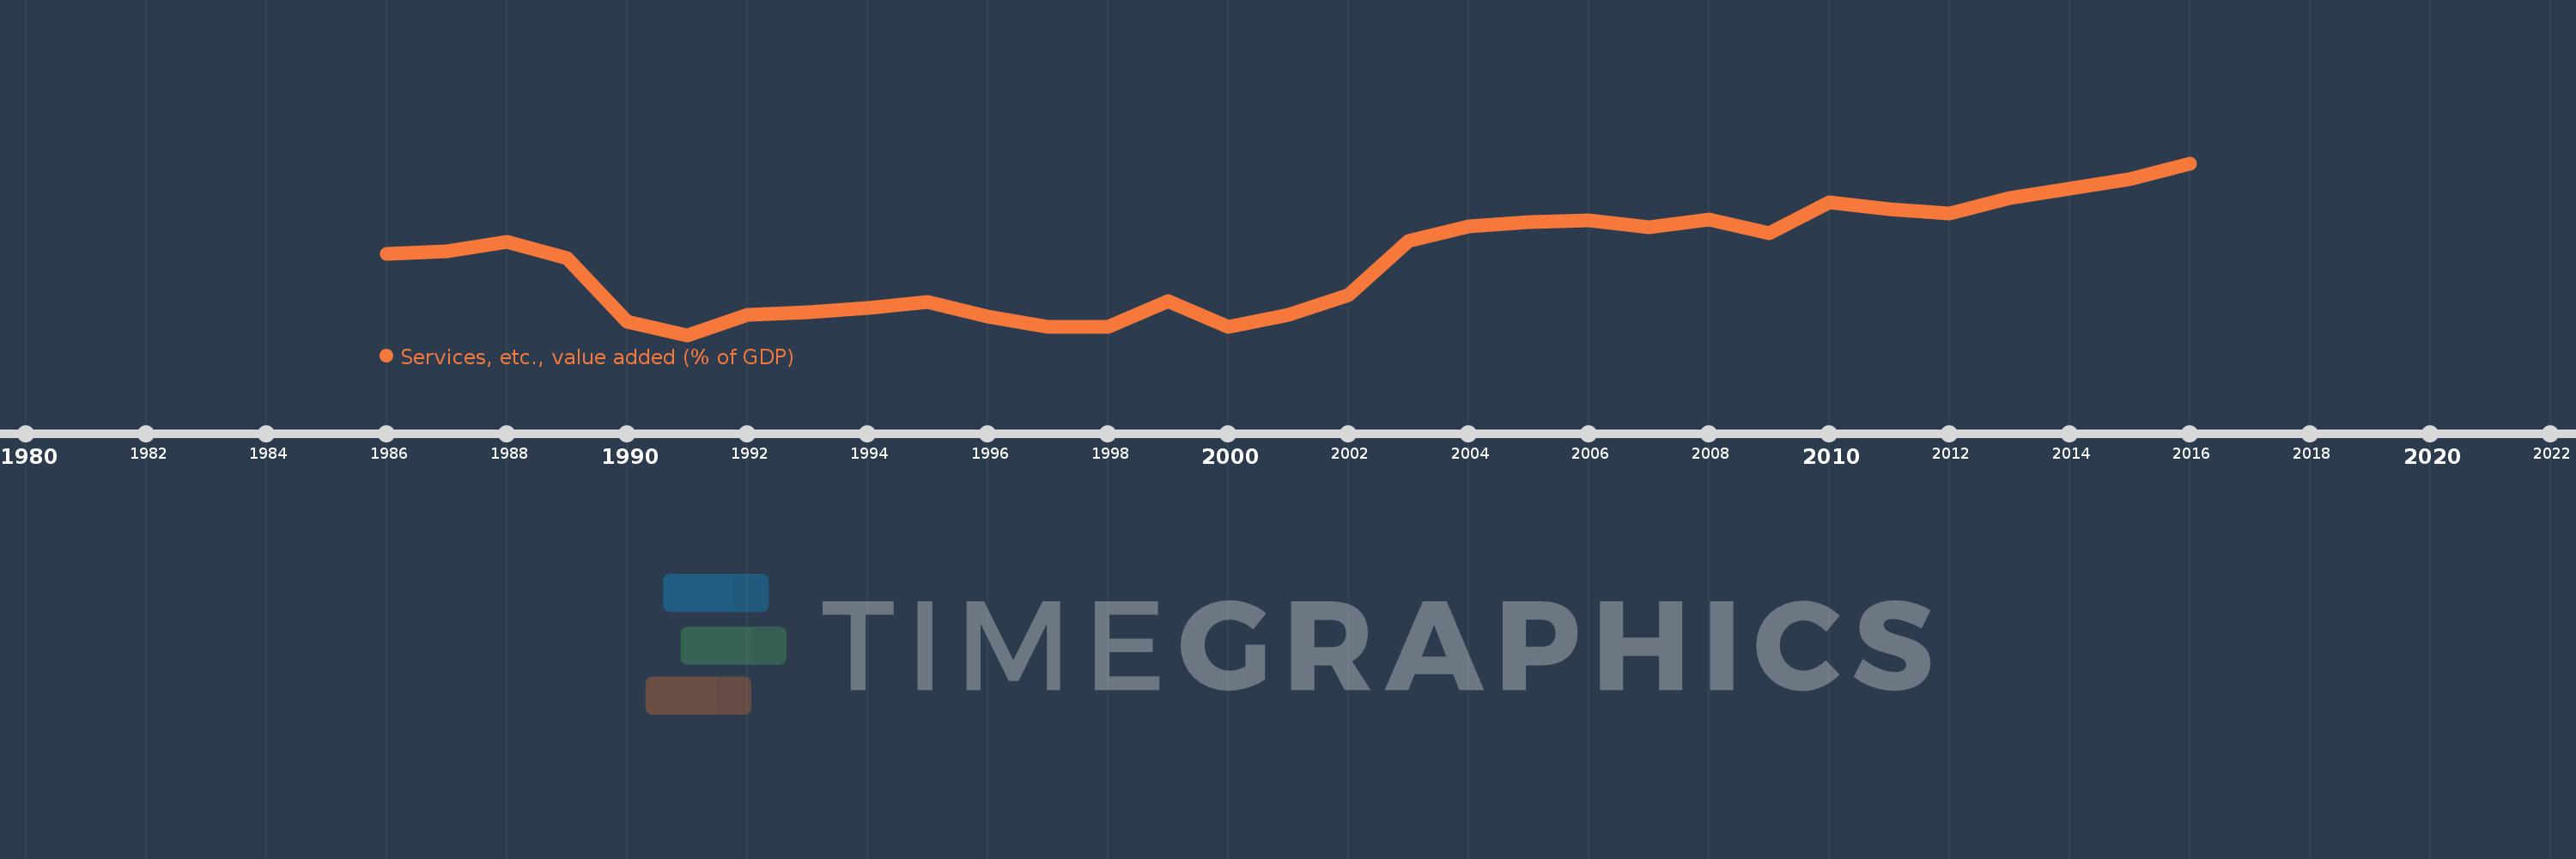
Least developed countries: UN classification
LDC
false
2
1
Services, etc., value added (% of GDP)
2016,2015,2014,2013,2012,2011,2010,2009,2008,2007,2006,2005,2004,2003,2002,2001,2000,1999,1998,1997,1996,1995,1994,1993,1992,1991,1990,1989,1988,1987,1986
Estas estadísticas en otros países:
AfghanistanAlbaniaAlgeriaAndorraAngolaAntigua and BarbudaArab WorldArgentinaArmeniaArubaAustraliaAustriaAzerbaijanBahamas, TheBahrainBangladeshBarbadosBelarusBelgiumBelizeBeninBermudaBhutanBoliviaBosnia and HerzegovinaBotswanaBrazilBrunei DarussalamBulgariaBurkina FasoBurundiCabo VerdeCambodiaCameroonCanadaCaribbean small statesCentral African RepublicCentral Europe and the BalticsChadChileChinaColombiaComorosCongo, Dem. Rep.Congo, Rep.Costa RicaCote d'IvoireCroatiaCubaCyprusCzech RepublicDenmarkDjiboutiDominicaDominican RepublicEarly-demographic dividendEast Asia & PacificEast Asia & Pacific (excluding high income)East Asia & Pacific (IDA & IBRD countries)EcuadorEgypt, Arab Rep.El SalvadorEquatorial GuineaEritreaEstoniaEthiopiaEuro areaEurope & Central AsiaEurope & Central Asia (excluding high income)Europe & Central Asia (IDA & IBRD countries)European UnionFaroe IslandsFijiFinlandFragile and conflict affected situationsFranceGabonGambia, TheGeorgiaGermanyGhanaGreeceGrenadaGuatemalaGuineaGuinea-BissauGuyanaHeavily indebted poor countries (HIPC)High incomeHondurasHong Kong SAR, ChinaHungaryIBRD onlyIcelandIDA & IBRD totalIDA blendIDA onlyIDA totalIndiaIndonesiaIran, Islamic Rep.IrelandItalyJamaicaJapanJordanKazakhstanKenyaKiribatiKorea, Rep.KosovoKuwaitKyrgyz RepublicLao PDRLate-demographic dividendLatin America & Caribbean Latin America & Caribbean (excluding high income)Latin America & the Caribbean (IDA & IBRD countries)LatviaLeast developed countries: UN classificationLebanonLesothoLibyaLithuaniaLow & middle incomeLow incomeLower middle incomeLuxembourgMacao SAR, ChinaMacedonia, FYRMadagascarMalawiMalaysiaMaldivesMaliMaltaMarshall IslandsMauritaniaMauritiusMexicoMicronesia, Fed. Sts.Middle East & North AfricaMiddle East & North Africa (excluding high income)Middle East & North Africa (IDA & IBRD countries)Middle incomeMoldovaMongoliaMontenegroMoroccoMozambiqueMyanmarNamibiaNepalNetherlandsNew CaledoniaNew ZealandNicaraguaNigerNigeriaNorth AmericaNorwayOECD membersOmanOther small statesPacific island small statesPakistanPalauPanamaPapua New GuineaParaguayPeruPhilippinesPolandPortugalPost-demographic dividendPre-demographic dividendPuerto RicoQatarRomaniaRussian FederationRwandaSao Tome and PrincipeSaudi ArabiaSenegalSerbiaSeychellesSierra LeoneSingaporeSlovak RepublicSloveniaSmall statesSolomon IslandsSomaliaSouth AfricaSouth AsiaSouth Asia (IDA & IBRD)SpainSri LankaSt. Kitts and NevisSt. LuciaSt. Vincent and the GrenadinesSub-Saharan Africa Sub-Saharan Africa (excluding high income)Sub-Saharan Africa (IDA & IBRD countries)SudanSurinameSwazilandSwedenSwitzerlandSyrian Arab RepublicTajikistanTanzaniaThailandTimor-LesteTogoTongaTrinidad and TobagoTunisiaTurkeyTurkmenistanTuvaluUgandaUkraineUnited KingdomUnited StatesUpper middle incomeUruguayUzbekistanVanuatuVenezuela, RBVietnamWest Bank and GazaWorldYemen, Rep.ZambiaZimbabwe línea de tiempo (timeline):
En esta escala de tiempo se presenta un gráfico de 1986 y 2016 de Least developed countries: UN classification. Los datos de 1985 están ausentes. El número de observaciones reales por fecha: 31.
Fuente (nombre):
Indicadores del desarrollo mundial
Fuente (organización):
World Bank national accounts data, and OECD National Accounts data files.
Categorías:
Economy & Growth
Se ha actualizado:
23 abr 2017 año
Los indicadores de los cambios de valor en los últimos años
Mínimo:
40.444
1 ene 1991 año
Máximo:
49.043
1 ene 2016 año
A la fecha de observación
Valor
Cambio absoluto
El cambio con respecto al valor anterior
1 ene 1986 año
44.524
+44.524
0.0%
1 ene 1987 año
44.645
+0.12
0.27%
1 ene 1988 año
45.127
+0.482
1.08%
1 ene 1989 año
44.282
-0.845
-1.87%
1 ene 1990 año
41.131
-3.151
-7.12%
1 ene 1991 año
40.444
-0.687
-1.67%
1 ene 1992 año
41.468
+1.024
2.53%
1 ene 1993 año
41.577
+0.109
0.26%
1 ene 1994 año
41.802
+0.225
0.54%
1 ene 1995 año
42.113
+0.311
0.74%
1 ene 1996 año
41.354
-0.758
-1.8%
1 ene 1997 año
40.861
-0.493
-1.19%
1 ene 1998 año
40.856
-0.006
-0.01%
1 ene 1999 año
42.156
+1.3
3.18%
1 ene 2000 año
40.833
-1.323
-3.14%
1 ene 2001 año
41.453
+0.621
1.52%
1 ene 2002 año
42.445
+0.992
2.39%
1 ene 2003 año
45.145
+2.7
6.36%
1 ene 2004 año
45.862
+0.717
1.59%
1 ene 2005 año
46.078
+0.216
0.47%
1 ene 2006 año
46.196
+0.118
0.26%
1 ene 2007 año
45.847
-0.349
-0.76%
1 ene 2008 año
46.241
+0.394
0.86%
1 ene 2009 año
45.554
-0.687
-1.49%
1 ene 2010 año
47.072
+1.518
3.33%
1 ene 2011 año
46.761
-0.311
-0.66%
1 ene 2012 año
46.508
-0.254
-0.54%
1 ene 2013 año
47.285
+0.777
1.67%
1 ene 2014 año
47.775
+0.49
1.04%
1 ene 2015 año
48.267
+0.491
1.03%
1 ene 2016 año
49.043
+0.776
1.61%
Ranking de los países por los datos estadísticos actuales


Comentarios: