29
/es/
es
AIzaSyAYiBZKx7MnpbEhh9jyipgxe19OcubqV5w
April 1, 2024
116241
Cuba
CUB
true
2
1
Services, etc., value added (% of GDP)
2012,2011,2010,2009,2008,2007,2006,2005,2004,2003,2002,2001,2000,1999,1998,1997,1996,1995,1994,1993,1992,1991,1990,1989,1988,1987,1986,1985,1984,1983,1982,1981,1980,1979,1978,1977,1976,1975,1974,1973,1972,1971
Estas estadísticas en otros países:
AfghanistanAlbaniaAlgeriaAndorraAngolaAntigua and BarbudaArab WorldArgentinaArmeniaArubaAustraliaAustriaAzerbaijanBahamas, TheBahrainBangladeshBarbadosBelarusBelgiumBelizeBeninBermudaBhutanBoliviaBosnia and HerzegovinaBotswanaBrazilBrunei DarussalamBulgariaBurkina FasoBurundiCabo VerdeCambodiaCameroonCanadaCaribbean small statesCentral African RepublicCentral Europe and the BalticsChadChileChinaColombiaComorosCongo, Dem. Rep.Congo, Rep.Costa RicaCote d'IvoireCroatiaCubaCyprusCzech RepublicDenmarkDjiboutiDominicaDominican RepublicEarly-demographic dividendEast Asia & PacificEast Asia & Pacific (excluding high income)East Asia & Pacific (IDA & IBRD countries)EcuadorEgypt, Arab Rep.El SalvadorEquatorial GuineaEritreaEstoniaEthiopiaEuro areaEurope & Central AsiaEurope & Central Asia (excluding high income)Europe & Central Asia (IDA & IBRD countries)European UnionFaroe IslandsFijiFinlandFragile and conflict affected situationsFranceGabonGambia, TheGeorgiaGermanyGhanaGreeceGrenadaGuatemalaGuineaGuinea-BissauGuyanaHeavily indebted poor countries (HIPC)High incomeHondurasHong Kong SAR, ChinaHungaryIBRD onlyIcelandIDA & IBRD totalIDA blendIDA onlyIDA totalIndiaIndonesiaIran, Islamic Rep.IrelandItalyJamaicaJapanJordanKazakhstanKenyaKiribatiKorea, Rep.KosovoKuwaitKyrgyz RepublicLao PDRLate-demographic dividendLatin America & Caribbean Latin America & Caribbean (excluding high income)Latin America & the Caribbean (IDA & IBRD countries)LatviaLeast developed countries: UN classificationLebanonLesothoLibyaLithuaniaLow & middle incomeLow incomeLower middle incomeLuxembourgMacao SAR, ChinaMacedonia, FYRMadagascarMalawiMalaysiaMaldivesMaliMaltaMarshall IslandsMauritaniaMauritiusMexicoMicronesia, Fed. Sts.Middle East & North AfricaMiddle East & North Africa (excluding high income)Middle East & North Africa (IDA & IBRD countries)Middle incomeMoldovaMongoliaMontenegroMoroccoMozambiqueMyanmarNamibiaNepalNetherlandsNew CaledoniaNew ZealandNicaraguaNigerNigeriaNorth AmericaNorwayOECD membersOmanOther small statesPacific island small statesPakistanPalauPanamaPapua New GuineaParaguayPeruPhilippinesPolandPortugalPost-demographic dividendPre-demographic dividendPuerto RicoQatarRomaniaRussian FederationRwandaSao Tome and PrincipeSaudi ArabiaSenegalSerbiaSeychellesSierra LeoneSingaporeSlovak RepublicSloveniaSmall statesSolomon IslandsSomaliaSouth AfricaSouth AsiaSouth Asia (IDA & IBRD)SpainSri LankaSt. Kitts and NevisSt. LuciaSt. Vincent and the GrenadinesSub-Saharan Africa Sub-Saharan Africa (excluding high income)Sub-Saharan Africa (IDA & IBRD countries)SudanSurinameSwazilandSwedenSwitzerlandSyrian Arab RepublicTajikistanTanzaniaThailandTimor-LesteTogoTongaTrinidad and TobagoTunisiaTurkeyTurkmenistanTuvaluUgandaUkraineUnited KingdomUnited StatesUpper middle incomeUruguayUzbekistanVanuatuVenezuela, RBVietnamWest Bank and GazaWorldYemen, Rep.ZambiaZimbabwe línea de tiempo (timeline):
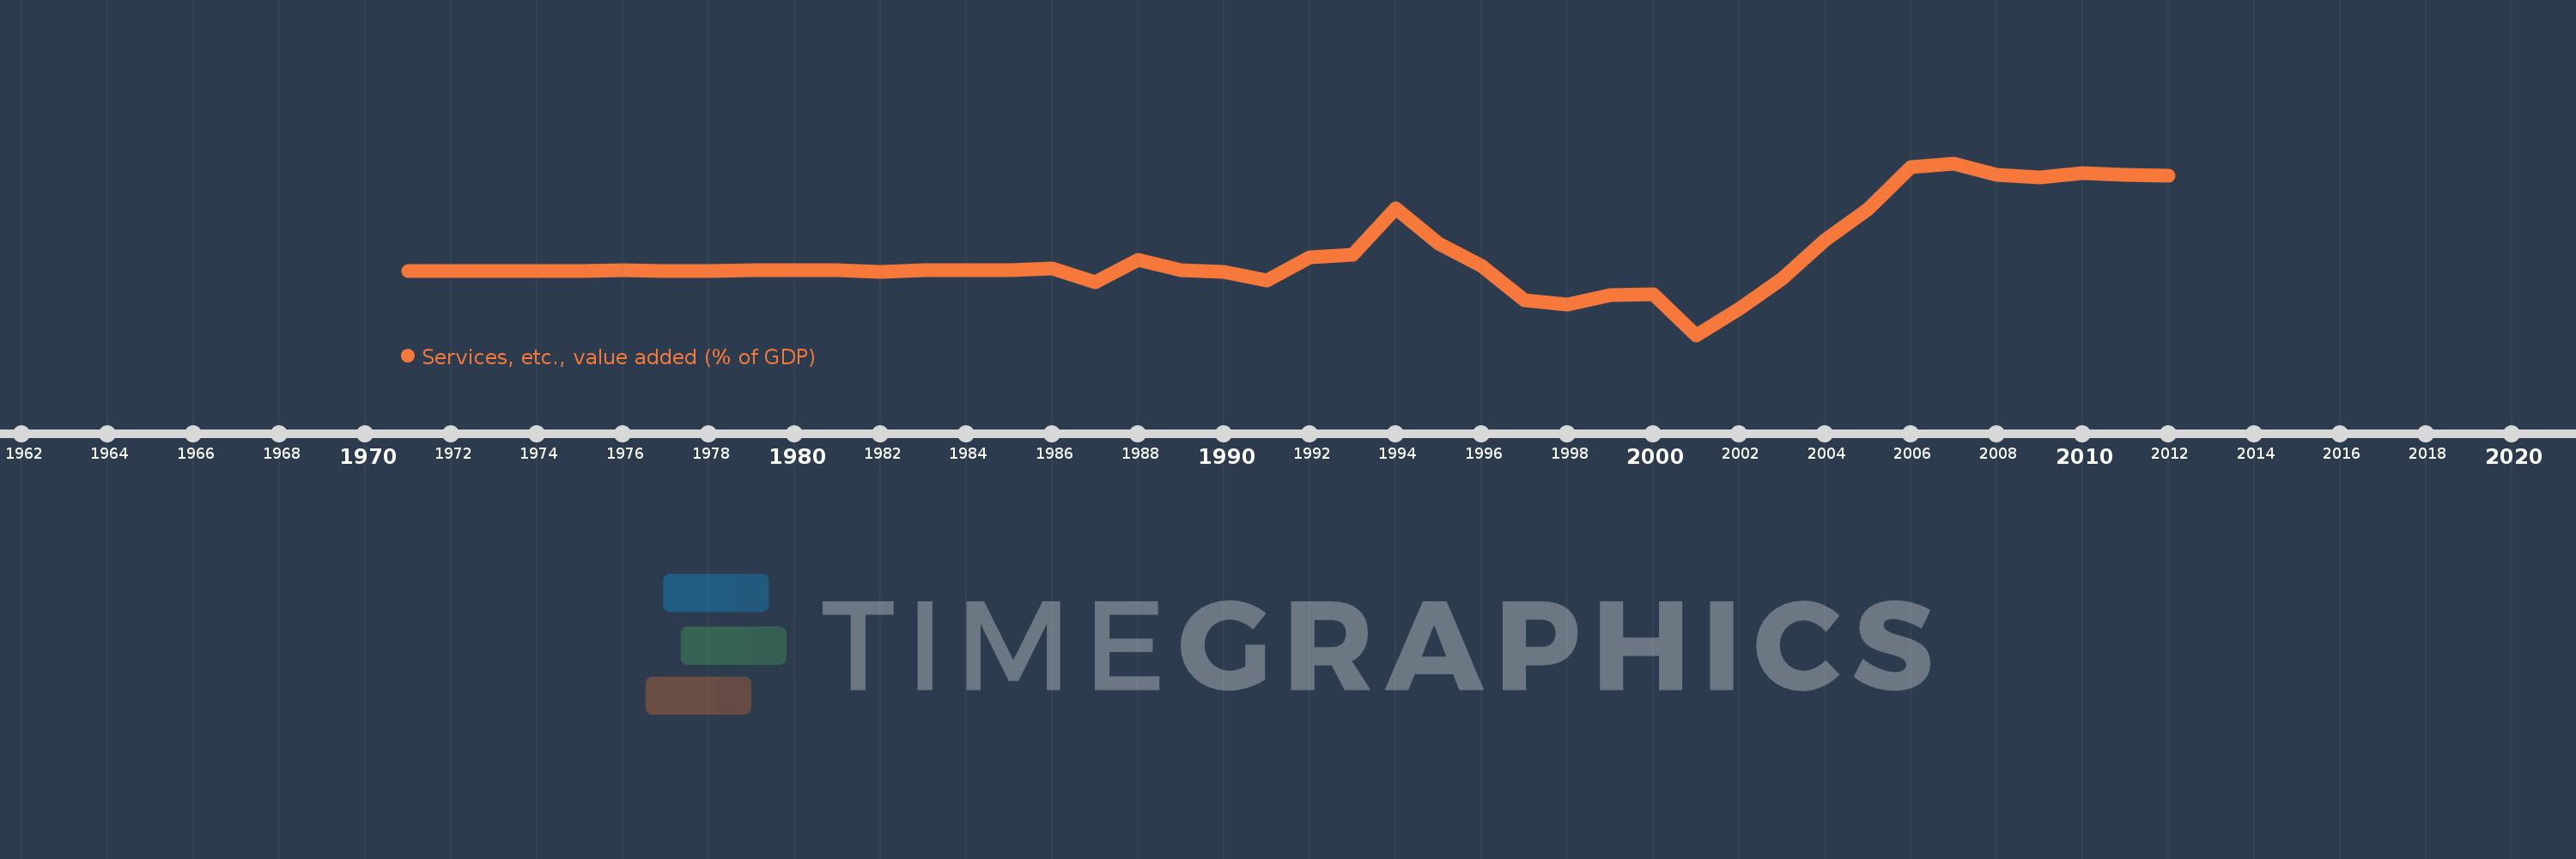
En esta escala de tiempo se presenta un gráfico de 1971 y 2012 de Cuba. Los datos de 1970 están ausentes. El número de observaciones reales por fecha: 42.
Fuente (nombre):
Indicadores del desarrollo mundial
Fuente (organización):
World Bank national accounts data, and OECD National Accounts data files.
Categorías:
Economy & Growth
Se ha actualizado:
23 abr 2017 año
Los indicadores de los cambios de valor en los últimos años
Mínimo:
63.702
1 ene 2001 año
Máximo:
75.295
1 ene 2007 año
A la fecha de observación
Valor
Cambio absoluto
El cambio con respecto al valor anterior
1 ene 1971 año
68.049
+68.049
0.0%
1 ene 1972 año
68.047
-0.002
0.0%
1 ene 1973 año
68.047
0.0
0.0%
1 ene 1974 año
68.048
+0.001
0.0%
1 ene 1975 año
68.049
+0.001
0.0%
1 ene 1976 año
68.054
+0.006
0.01%
1 ene 1977 año
68.037
-0.018
-0.03%
1 ene 1978 año
68.045
+0.009
0.01%
1 ene 1979 año
68.052
+0.007
0.01%
1 ene 1980 año
68.055
+0.003
0.0%
1 ene 1981 año
68.082
+0.027
0.04%
1 ene 1982 año
67.948
-0.134
-0.2%
1 ene 1983 año
68.088
+0.139
0.21%
1 ene 1984 año
68.088
+0.0
0.0%
1 ene 1985 año
68.07
-0.017
-0.03%
1 ene 1986 año
68.22
+0.149
0.22%
1 ene 1987 año
67.28
-0.939
-1.38%
1 ene 1988 año
68.774
+1.493
2.22%
1 ene 1989 año
68.088
-0.686
-1.0%
1 ene 1990 año
67.985
-0.103
-0.15%
1 ene 1991 año
67.377
-0.608
-0.89%
1 ene 1992 año
68.964
+1.586
2.35%
1 ene 1993 año
69.097
+0.134
0.19%
1 ene 1994 año
72.259
+3.161
4.58%
1 ene 1995 año
69.892
-2.367
-3.28%
1 ene 1996 año
68.358
-1.534
-2.19%
1 ene 1997 año
66.053
-2.305
-3.37%
1 ene 1998 año
65.761
-0.292
-0.44%
1 ene 1999 año
66.393
+0.632
0.96%
1 ene 2000 año
66.47
+0.078
0.12%
1 ene 2001 año
63.702
-2.768
-4.16%
1 ene 2002 año
65.444
+1.741
2.73%
1 ene 2003 año
67.496
+2.052
3.14%
1 ene 2004 año
70.12
+2.624
3.89%
1 ene 2005 año
72.167
+2.048
2.92%
1 ene 2006 año
75.007
+2.839
3.93%
1 ene 2007 año
75.295
+0.288
0.38%
1 ene 2008 año
74.535
-0.759
-1.01%
1 ene 2009 año
74.335
-0.201
-0.27%
1 ene 2010 año
74.601
+0.266
0.36%
1 ene 2011 año
74.49
-0.111
-0.15%
1 ene 2012 año
74.475
-0.015
-0.02%
Ranking de los países por los datos estadísticos actuales


Comentarios: