29
/es/
es
AIzaSyAYiBZKx7MnpbEhh9jyipgxe19OcubqV5w
April 1, 2024
125526
Egypt, Arab Rep.
EGY
true
2
1
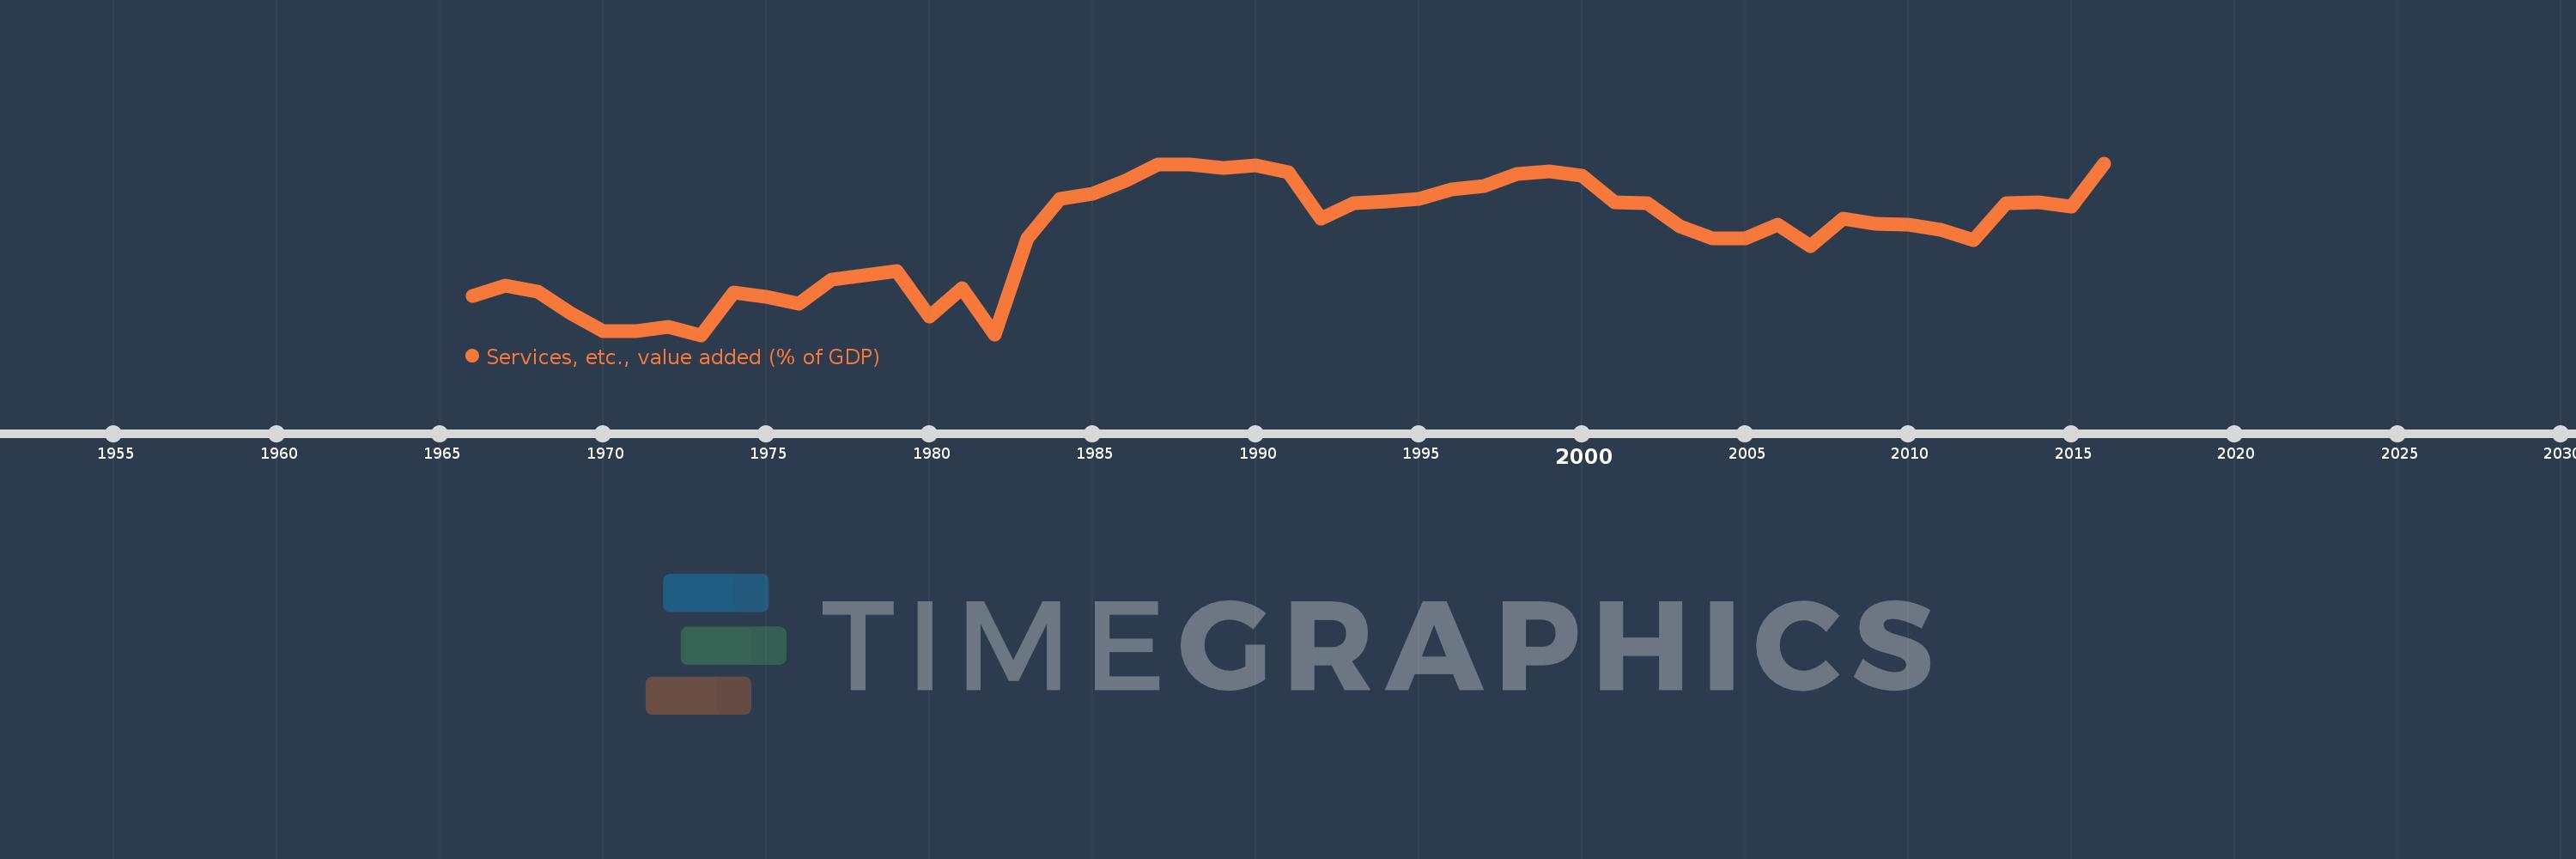
Services, etc., value added (% of GDP)
2016,2015,2014,2013,2012,2011,2010,2009,2008,2007,2006,2005,2004,2003,2002,2001,2000,1999,1998,1997,1996,1995,1994,1993,1992,1991,1990,1989,1988,1987,1986,1985,1984,1983,1982,1981,1980,1979,1978,1977,1976,1975,1974,1973,1972,1971,1970,1969,1968,1967,1966
Estas estadísticas en otros países:
AfghanistanAlbaniaAlgeriaAndorraAngolaAntigua and BarbudaArab WorldArgentinaArmeniaArubaAustraliaAustriaAzerbaijanBahamas, TheBahrainBangladeshBarbadosBelarusBelgiumBelizeBeninBermudaBhutanBoliviaBosnia and HerzegovinaBotswanaBrazilBrunei DarussalamBulgariaBurkina FasoBurundiCabo VerdeCambodiaCameroonCanadaCaribbean small statesCentral African RepublicCentral Europe and the BalticsChadChileChinaColombiaComorosCongo, Dem. Rep.Congo, Rep.Costa RicaCote d'IvoireCroatiaCubaCyprusCzech RepublicDenmarkDjiboutiDominicaDominican RepublicEarly-demographic dividendEast Asia & PacificEast Asia & Pacific (excluding high income)East Asia & Pacific (IDA & IBRD countries)EcuadorEgypt, Arab Rep.El SalvadorEquatorial GuineaEritreaEstoniaEthiopiaEuro areaEurope & Central AsiaEurope & Central Asia (excluding high income)Europe & Central Asia (IDA & IBRD countries)European UnionFaroe IslandsFijiFinlandFragile and conflict affected situationsFranceGabonGambia, TheGeorgiaGermanyGhanaGreeceGrenadaGuatemalaGuineaGuinea-BissauGuyanaHeavily indebted poor countries (HIPC)High incomeHondurasHong Kong SAR, ChinaHungaryIBRD onlyIcelandIDA & IBRD totalIDA blendIDA onlyIDA totalIndiaIndonesiaIran, Islamic Rep.IrelandItalyJamaicaJapanJordanKazakhstanKenyaKiribatiKorea, Rep.KosovoKuwaitKyrgyz RepublicLao PDRLate-demographic dividendLatin America & Caribbean Latin America & Caribbean (excluding high income)Latin America & the Caribbean (IDA & IBRD countries)LatviaLeast developed countries: UN classificationLebanonLesothoLibyaLithuaniaLow & middle incomeLow incomeLower middle incomeLuxembourgMacao SAR, ChinaMacedonia, FYRMadagascarMalawiMalaysiaMaldivesMaliMaltaMarshall IslandsMauritaniaMauritiusMexicoMicronesia, Fed. Sts.Middle East & North AfricaMiddle East & North Africa (excluding high income)Middle East & North Africa (IDA & IBRD countries)Middle incomeMoldovaMongoliaMontenegroMoroccoMozambiqueMyanmarNamibiaNepalNetherlandsNew CaledoniaNew ZealandNicaraguaNigerNigeriaNorth AmericaNorwayOECD membersOmanOther small statesPacific island small statesPakistanPalauPanamaPapua New GuineaParaguayPeruPhilippinesPolandPortugalPost-demographic dividendPre-demographic dividendPuerto RicoQatarRomaniaRussian FederationRwandaSao Tome and PrincipeSaudi ArabiaSenegalSerbiaSeychellesSierra LeoneSingaporeSlovak RepublicSloveniaSmall statesSolomon IslandsSomaliaSouth AfricaSouth AsiaSouth Asia (IDA & IBRD)SpainSri LankaSt. Kitts and NevisSt. LuciaSt. Vincent and the GrenadinesSub-Saharan Africa Sub-Saharan Africa (excluding high income)Sub-Saharan Africa (IDA & IBRD countries)SudanSurinameSwazilandSwedenSwitzerlandSyrian Arab RepublicTajikistanTanzaniaThailandTimor-LesteTogoTongaTrinidad and TobagoTunisiaTurkeyTurkmenistanTuvaluUgandaUkraineUnited KingdomUnited StatesUpper middle incomeUruguayUzbekistanVanuatuVenezuela, RBVietnamWest Bank and GazaWorldYemen, Rep.ZambiaZimbabwe línea de tiempo (timeline):
En esta escala de tiempo se presenta un gráfico de 1966 y 2016 de Egypt, Arab Rep.. Los datos de 1965 están ausentes. El número de observaciones reales por fecha: 51.
Fuente (nombre):
Indicadores del desarrollo mundial
Fuente (organización):
World Bank national accounts data, and OECD National Accounts data files.
Categorías:
Economy & Growth
Se ha actualizado:
23 abr 2017 año
Los indicadores de los cambios de valor en los últimos años
Mínimo:
42.153
1 ene 1973 año
Máximo:
52.499
1 ene 2016 año
A la fecha de observación
Valor
Cambio absoluto
El cambio con respecto al valor anterior
1 ene 1966 año
44.504
+44.504
0.0%
1 ene 1967 año
45.104
+0.6
1.35%
1 ene 1968 año
44.764
-0.34
-0.75%
1 ene 1969 año
43.462
-1.302
-2.91%
1 ene 1970 año
42.406
-1.055
-2.43%
1 ene 1971 año
42.395
-0.011
-0.03%
1 ene 1972 año
42.646
+0.25
0.59%
1 ene 1973 año
42.153
-0.493
-1.15%
1 ene 1974 año
44.731
+2.578
6.11%
1 ene 1975 año
44.437
-0.294
-0.66%
1 ene 1976 año
44.066
-0.37
-0.83%
1 ene 1977 año
45.515
+1.449
3.29%
1 ene 1978 año
45.726
+0.211
0.46%
1 ene 1979 año
46.026
+0.3
0.66%
1 ene 1980 año
43.253
-2.773
-6.03%
1 ene 1981 año
44.957
+1.705
3.94%
1 ene 1982 año
42.176
-2.781
-6.19%
1 ene 1983 año
47.987
+5.811
13.78%
1 ene 1984 año
50.372
+2.385
4.97%
1 ene 1985 año
50.666
+0.294
0.58%
1 ene 1986 año
51.455
+0.789
1.56%
1 ene 1987 año
52.4
+0.945
1.84%
1 ene 1988 año
52.425
+0.025
0.05%
1 ene 1989 año
52.2
-0.225
-0.43%
1 ene 1990 año
52.345
+0.145
0.28%
1 ene 1991 año
51.963
-0.382
-0.73%
1 ene 1992 año
49.182
-2.781
-5.35%
1 ene 1993 año
50.119
+0.937
1.91%
1 ene 1994 año
50.214
+0.095
0.19%
1 ene 1995 año
50.37
+0.156
0.31%
1 ene 1996 año
50.919
+0.548
1.09%
1 ene 1997 año
51.124
+0.206
0.4%
1 ene 1998 año
51.831
+0.706
1.38%
1 ene 1999 año
52.025
+0.194
0.37%
1 ene 2000 año
51.767
-0.258
-0.5%
1 ene 2001 año
50.127
-1.64
-3.17%
1 ene 2002 año
50.112
-0.015
-0.03%
1 ene 2003 año
48.718
-1.394
-2.78%
1 ene 2004 año
47.994
-0.724
-1.49%
1 ene 2005 año
47.954
-0.04
-0.08%
1 ene 2006 año
48.793
+0.839
1.75%
1 ene 2007 año
47.501
-1.292
-2.65%
1 ene 2008 año
49.166
+1.665
3.5%
1 ene 2009 año
48.862
-0.304
-0.62%
1 ene 2010 año
48.821
-0.04
-0.08%
1 ene 2011 año
48.483
-0.338
-0.69%
1 ene 2012 año
47.852
-0.632
-1.3%
1 ene 2013 año
50.084
+2.232
4.66%
1 ene 2014 año
50.123
+0.039
0.08%
1 ene 2015 año
49.897
-0.226
-0.45%
1 ene 2016 año
52.499
+2.602
5.21%
Ranking de los países por los datos estadísticos actuales


Comentarios: