29
/es/
es
AIzaSyAYiBZKx7MnpbEhh9jyipgxe19OcubqV5w
April 1, 2024
70514
Argentina
ARG
true
2
1
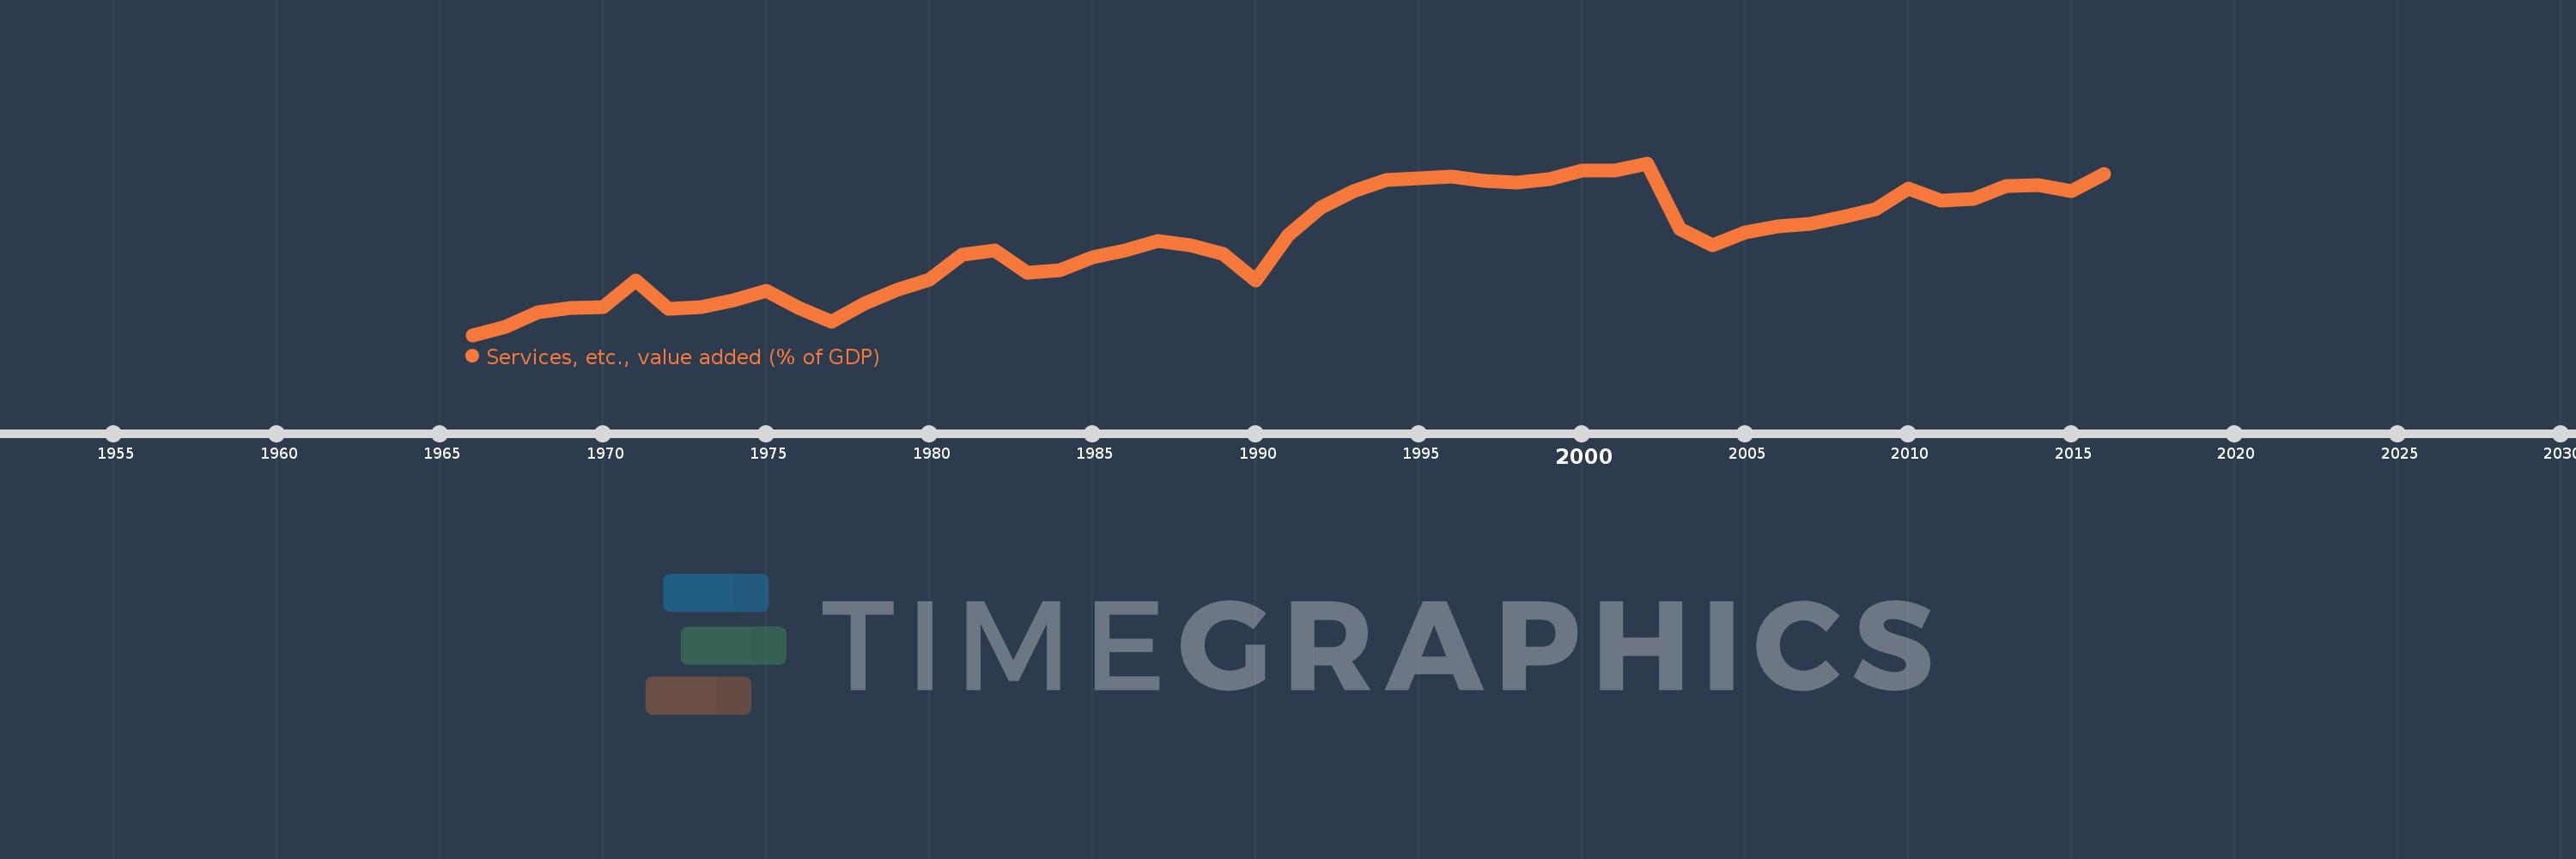
Services, etc., value added (% of GDP)
2016,2015,2014,2013,2012,2011,2010,2009,2008,2007,2006,2005,2004,2003,2002,2001,2000,1999,1998,1997,1996,1995,1994,1993,1992,1991,1990,1989,1988,1987,1986,1985,1984,1983,1982,1981,1980,1979,1978,1977,1976,1975,1974,1973,1972,1971,1970,1969,1968,1967,1966
Estas estadísticas en otros países:
AfghanistanAlbaniaAlgeriaAndorraAngolaAntigua and BarbudaArab WorldArgentinaArmeniaArubaAustraliaAustriaAzerbaijanBahamas, TheBahrainBangladeshBarbadosBelarusBelgiumBelizeBeninBermudaBhutanBoliviaBosnia and HerzegovinaBotswanaBrazilBrunei DarussalamBulgariaBurkina FasoBurundiCabo VerdeCambodiaCameroonCanadaCaribbean small statesCentral African RepublicCentral Europe and the BalticsChadChileChinaColombiaComorosCongo, Dem. Rep.Congo, Rep.Costa RicaCote d'IvoireCroatiaCubaCyprusCzech RepublicDenmarkDjiboutiDominicaDominican RepublicEarly-demographic dividendEast Asia & PacificEast Asia & Pacific (excluding high income)East Asia & Pacific (IDA & IBRD countries)EcuadorEgypt, Arab Rep.El SalvadorEquatorial GuineaEritreaEstoniaEthiopiaEuro areaEurope & Central AsiaEurope & Central Asia (excluding high income)Europe & Central Asia (IDA & IBRD countries)European UnionFaroe IslandsFijiFinlandFragile and conflict affected situationsFranceGabonGambia, TheGeorgiaGermanyGhanaGreeceGrenadaGuatemalaGuineaGuinea-BissauGuyanaHeavily indebted poor countries (HIPC)High incomeHondurasHong Kong SAR, ChinaHungaryIBRD onlyIcelandIDA & IBRD totalIDA blendIDA onlyIDA totalIndiaIndonesiaIran, Islamic Rep.IrelandItalyJamaicaJapanJordanKazakhstanKenyaKiribatiKorea, Rep.KosovoKuwaitKyrgyz RepublicLao PDRLate-demographic dividendLatin America & Caribbean Latin America & Caribbean (excluding high income)Latin America & the Caribbean (IDA & IBRD countries)LatviaLeast developed countries: UN classificationLebanonLesothoLibyaLithuaniaLow & middle incomeLow incomeLower middle incomeLuxembourgMacao SAR, ChinaMacedonia, FYRMadagascarMalawiMalaysiaMaldivesMaliMaltaMarshall IslandsMauritaniaMauritiusMexicoMicronesia, Fed. Sts.Middle East & North AfricaMiddle East & North Africa (excluding high income)Middle East & North Africa (IDA & IBRD countries)Middle incomeMoldovaMongoliaMontenegroMoroccoMozambiqueMyanmarNamibiaNepalNetherlandsNew CaledoniaNew ZealandNicaraguaNigerNigeriaNorth AmericaNorwayOECD membersOmanOther small statesPacific island small statesPakistanPalauPanamaPapua New GuineaParaguayPeruPhilippinesPolandPortugalPost-demographic dividendPre-demographic dividendPuerto RicoQatarRomaniaRussian FederationRwandaSao Tome and PrincipeSaudi ArabiaSenegalSerbiaSeychellesSierra LeoneSingaporeSlovak RepublicSloveniaSmall statesSolomon IslandsSomaliaSouth AfricaSouth AsiaSouth Asia (IDA & IBRD)SpainSri LankaSt. Kitts and NevisSt. LuciaSt. Vincent and the GrenadinesSub-Saharan Africa Sub-Saharan Africa (excluding high income)Sub-Saharan Africa (IDA & IBRD countries)SudanSurinameSwazilandSwedenSwitzerlandSyrian Arab RepublicTajikistanTanzaniaThailandTimor-LesteTogoTongaTrinidad and TobagoTunisiaTurkeyTurkmenistanTuvaluUgandaUkraineUnited KingdomUnited StatesUpper middle incomeUruguayUzbekistanVanuatuVenezuela, RBVietnamWest Bank and GazaWorldYemen, Rep.ZambiaZimbabwe línea de tiempo (timeline):
En esta escala de tiempo se presenta un gráfico de 1966 y 2016 de Argentina. Los datos de 1965 están ausentes. El número de observaciones reales por fecha: 51.
Fuente (nombre):
Indicadores del desarrollo mundial
Fuente (organización):
World Bank national accounts data, and OECD National Accounts data files.
Categorías:
Economy & Growth
Se ha actualizado:
23 abr 2017 año
Los indicadores de los cambios de valor en los últimos años
Mínimo:
38.681
1 ene 1966 año
Máximo:
68.072
1 ene 2002 año
A la fecha de observación
Valor
Cambio absoluto
El cambio con respecto al valor anterior
1 ene 1966 año
38.681
+38.681
0.0%
1 ene 1967 año
40.116
+1.435
3.71%
1 ene 1968 año
42.636
+2.52
6.28%
1 ene 1969 año
43.243
+0.606
1.42%
1 ene 1970 año
43.428
+0.185
0.43%
1 ene 1971 año
48.084
+4.656
10.72%
1 ene 1972 año
43.179
-4.905
-10.2%
1 ene 1973 año
43.433
+0.254
0.59%
1 ene 1974 año
44.695
+1.262
2.9%
1 ene 1975 año
46.176
+1.481
3.31%
1 ene 1976 año
43.275
-2.902
-6.28%
1 ene 1977 año
40.954
-2.321
-5.36%
1 ene 1978 año
44.107
+3.153
7.7%
1 ene 1979 año
46.398
+2.291
5.19%
1 ene 1980 año
48.176
+1.778
3.83%
1 ene 1981 año
52.427
+4.251
8.82%
1 ene 1982 año
53.186
+0.759
1.45%
1 ene 1983 año
49.301
-3.885
-7.31%
1 ene 1984 año
49.785
+0.484
0.98%
1 ene 1985 año
51.946
+2.16
4.34%
1 ene 1986 año
53.09
+1.144
2.2%
1 ene 1987 año
54.819
+1.73
3.26%
1 ene 1988 año
54.077
-0.742
-1.35%
1 ene 1989 año
52.536
-1.541
-2.85%
1 ene 1990 año
48.036
-4.499
-8.56%
1 ene 1991 año
55.854
+7.818
16.28%
1 ene 1992 año
60.561
+4.707
8.43%
1 ene 1993 año
63.325
+2.764
4.56%
1 ene 1994 año
65.279
+1.954
3.09%
1 ene 1995 año
65.462
+0.183
0.28%
1 ene 1996 año
65.771
+0.31
0.47%
1 ene 1997 año
65.097
-0.674
-1.03%
1 ene 1998 año
64.798
-0.299
-0.46%
1 ene 1999 año
65.296
+0.498
0.77%
1 ene 2000 año
66.891
+1.595
2.44%
1 ene 2001 año
66.884
-0.007
-0.01%
1 ene 2002 año
68.072
+1.188
1.78%
1 ene 2003 año
56.778
-11.294
-16.59%
1 ene 2004 año
54.055
-2.722
-4.79%
1 ene 2005 año
56.297
+2.241
4.15%
1 ene 2006 año
57.223
+0.926
1.65%
1 ene 2007 año
57.665
+0.442
0.77%
1 ene 2008 año
58.907
+1.242
2.15%
1 ene 2009 año
60.159
+1.252
2.13%
1 ene 2010 año
63.775
+3.616
6.01%
1 ene 2011 año
61.656
-2.119
-3.32%
1 ene 2012 año
61.931
+0.275
0.45%
1 ene 2013 año
64.224
+2.293
3.7%
1 ene 2014 año
64.304
+0.08
0.13%
1 ene 2015 año
63.361
-0.943
-1.47%
1 ene 2016 año
66.23
+2.868
4.53%
Ranking de los países por los datos estadísticos actuales


Comentarios: