29
/es/
es
AIzaSyAYiBZKx7MnpbEhh9jyipgxe19OcubqV5w
April 1, 2024
196276
Mexico
MEX
true
2
1
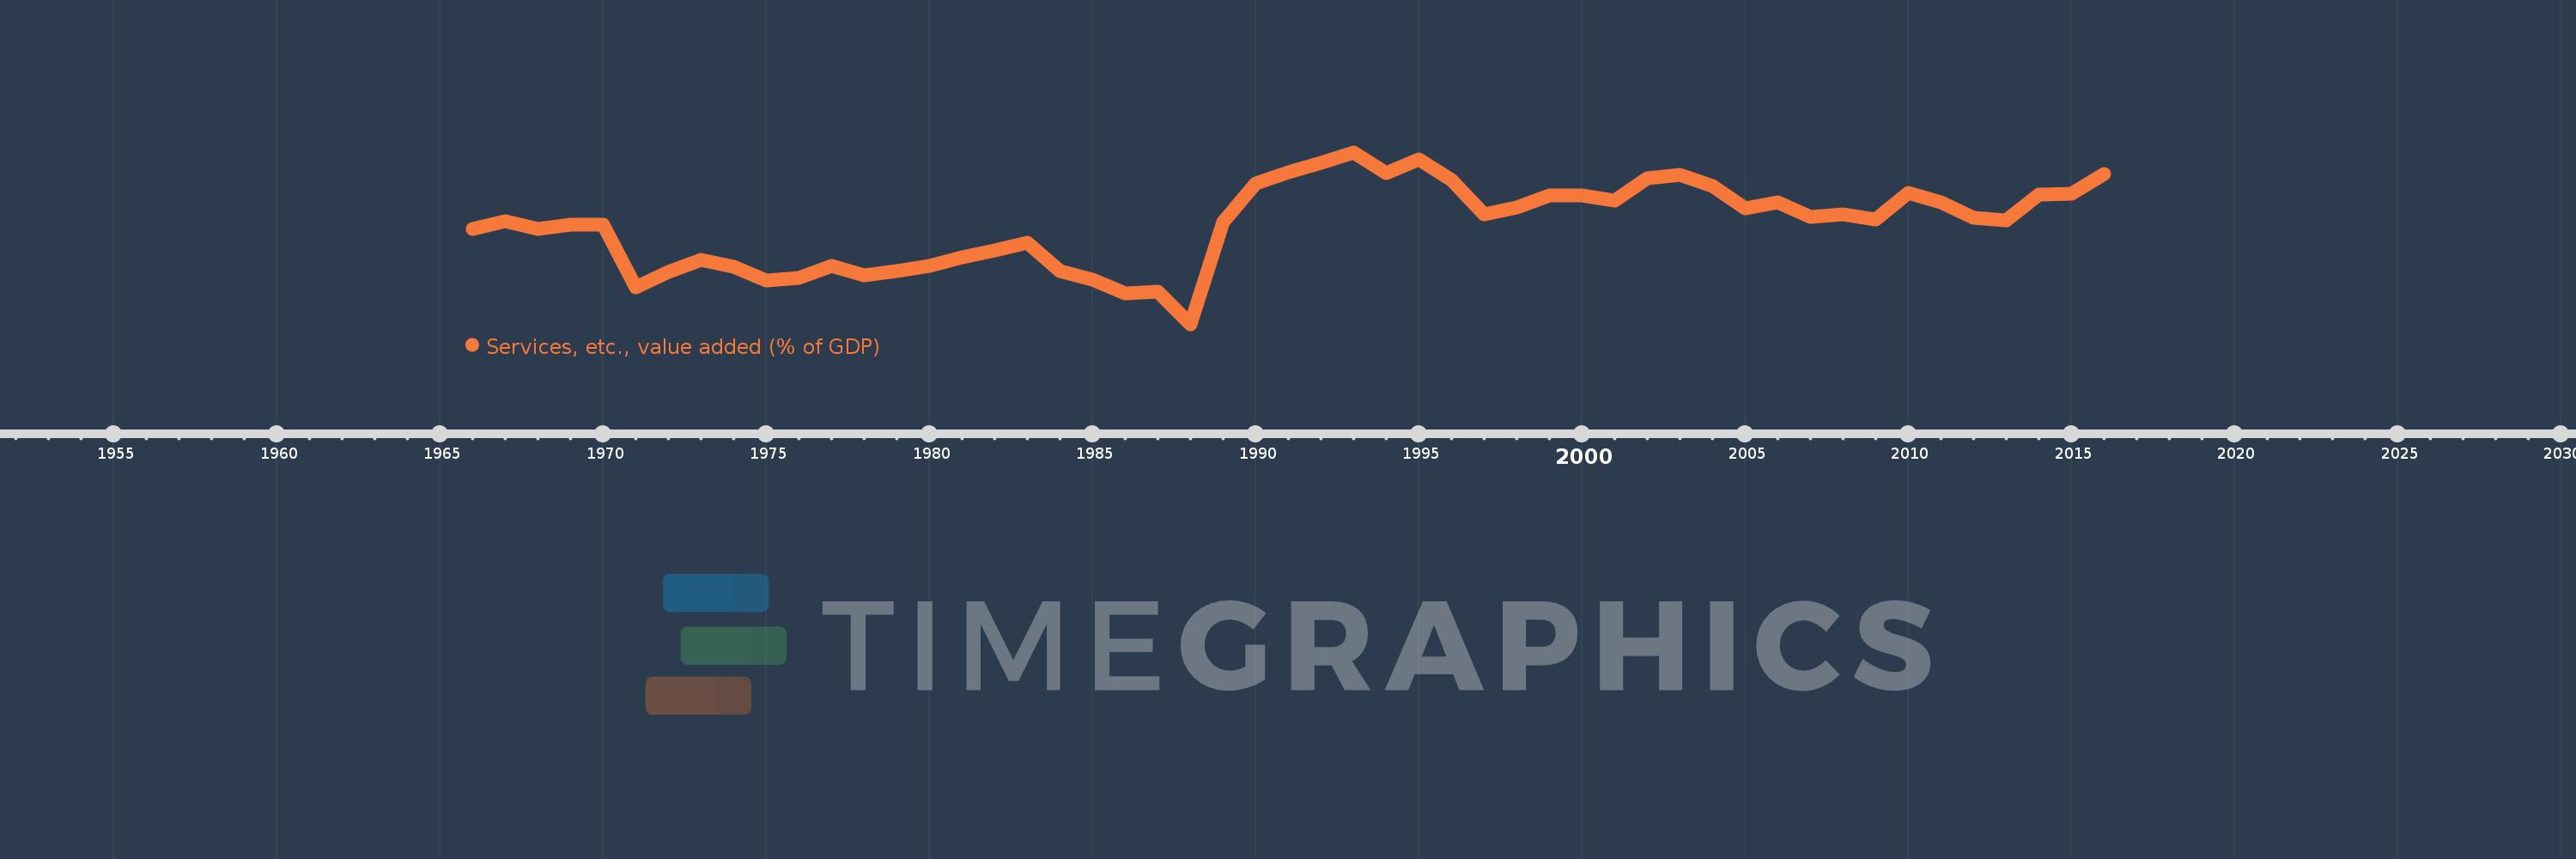
Services, etc., value added (% of GDP)
2016,2015,2014,2013,2012,2011,2010,2009,2008,2007,2006,2005,2004,2003,2002,2001,2000,1999,1998,1997,1996,1995,1994,1993,1992,1991,1990,1989,1988,1987,1986,1985,1984,1983,1982,1981,1980,1979,1978,1977,1976,1975,1974,1973,1972,1971,1970,1969,1968,1967,1966
Estas estadísticas en otros países:
AfghanistanAlbaniaAlgeriaAndorraAngolaAntigua and BarbudaArab WorldArgentinaArmeniaArubaAustraliaAustriaAzerbaijanBahamas, TheBahrainBangladeshBarbadosBelarusBelgiumBelizeBeninBermudaBhutanBoliviaBosnia and HerzegovinaBotswanaBrazilBrunei DarussalamBulgariaBurkina FasoBurundiCabo VerdeCambodiaCameroonCanadaCaribbean small statesCentral African RepublicCentral Europe and the BalticsChadChileChinaColombiaComorosCongo, Dem. Rep.Congo, Rep.Costa RicaCote d'IvoireCroatiaCubaCyprusCzech RepublicDenmarkDjiboutiDominicaDominican RepublicEarly-demographic dividendEast Asia & PacificEast Asia & Pacific (excluding high income)East Asia & Pacific (IDA & IBRD countries)EcuadorEgypt, Arab Rep.El SalvadorEquatorial GuineaEritreaEstoniaEthiopiaEuro areaEurope & Central AsiaEurope & Central Asia (excluding high income)Europe & Central Asia (IDA & IBRD countries)European UnionFaroe IslandsFijiFinlandFragile and conflict affected situationsFranceGabonGambia, TheGeorgiaGermanyGhanaGreeceGrenadaGuatemalaGuineaGuinea-BissauGuyanaHeavily indebted poor countries (HIPC)High incomeHondurasHong Kong SAR, ChinaHungaryIBRD onlyIcelandIDA & IBRD totalIDA blendIDA onlyIDA totalIndiaIndonesiaIran, Islamic Rep.IrelandItalyJamaicaJapanJordanKazakhstanKenyaKiribatiKorea, Rep.KosovoKuwaitKyrgyz RepublicLao PDRLate-demographic dividendLatin America & Caribbean Latin America & Caribbean (excluding high income)Latin America & the Caribbean (IDA & IBRD countries)LatviaLeast developed countries: UN classificationLebanonLesothoLibyaLithuaniaLow & middle incomeLow incomeLower middle incomeLuxembourgMacao SAR, ChinaMacedonia, FYRMadagascarMalawiMalaysiaMaldivesMaliMaltaMarshall IslandsMauritaniaMauritiusMexicoMicronesia, Fed. Sts.Middle East & North AfricaMiddle East & North Africa (excluding high income)Middle East & North Africa (IDA & IBRD countries)Middle incomeMoldovaMongoliaMontenegroMoroccoMozambiqueMyanmarNamibiaNepalNetherlandsNew CaledoniaNew ZealandNicaraguaNigerNigeriaNorth AmericaNorwayOECD membersOmanOther small statesPacific island small statesPakistanPalauPanamaPapua New GuineaParaguayPeruPhilippinesPolandPortugalPost-demographic dividendPre-demographic dividendPuerto RicoQatarRomaniaRussian FederationRwandaSao Tome and PrincipeSaudi ArabiaSenegalSerbiaSeychellesSierra LeoneSingaporeSlovak RepublicSloveniaSmall statesSolomon IslandsSomaliaSouth AfricaSouth AsiaSouth Asia (IDA & IBRD)SpainSri LankaSt. Kitts and NevisSt. LuciaSt. Vincent and the GrenadinesSub-Saharan Africa Sub-Saharan Africa (excluding high income)Sub-Saharan Africa (IDA & IBRD countries)SudanSurinameSwazilandSwedenSwitzerlandSyrian Arab RepublicTajikistanTanzaniaThailandTimor-LesteTogoTongaTrinidad and TobagoTunisiaTurkeyTurkmenistanTuvaluUgandaUkraineUnited KingdomUnited StatesUpper middle incomeUruguayUzbekistanVanuatuVenezuela, RBVietnamWest Bank and GazaWorldYemen, Rep.ZambiaZimbabwe línea de tiempo (timeline):
En esta escala de tiempo se presenta un gráfico de 1966 y 2016 de Mexico. Los datos de 1965 están ausentes. El número de observaciones reales por fecha: 51.
Fuente (nombre):
Indicadores del desarrollo mundial
Fuente (organización):
World Bank national accounts data, and OECD National Accounts data files.
Categorías:
Economy & Growth
Se ha actualizado:
23 abr 2017 año
Los indicadores de los cambios de valor en los últimos años
Mínimo:
52.326
1 ene 1988 año
Máximo:
65.217
1 ene 1993 año
A la fecha de observación
Valor
Cambio absoluto
El cambio con respecto al valor anterior
1 ene 1966 año
59.452
+59.452
0.0%
1 ene 1967 año
60.073
+0.62
1.04%
1 ene 1968 año
59.495
-0.577
-0.96%
1 ene 1969 año
59.815
+0.32
0.54%
1 ene 1970 año
59.802
-0.013
-0.02%
1 ene 1971 año
55.114
-4.688
-7.84%
1 ene 1972 año
56.242
+1.128
2.05%
1 ene 1973 año
57.129
+0.887
1.58%
1 ene 1974 año
56.617
-0.512
-0.9%
1 ene 1975 año
55.609
-1.008
-1.78%
1 ene 1976 año
55.803
+0.194
0.35%
1 ene 1977 año
56.722
+0.92
1.65%
1 ene 1978 año
55.975
-0.747
-1.32%
1 ene 1979 año
56.346
+0.371
0.66%
1 ene 1980 año
56.715
+0.369
0.65%
1 ene 1981 año
57.355
+0.64
1.13%
1 ene 1982 año
57.861
+0.506
0.88%
1 ene 1983 año
58.446
+0.585
1.01%
1 ene 1984 año
56.32
-2.127
-3.64%
1 ene 1985 año
55.665
-0.655
-1.16%
1 ene 1986 año
54.661
-1.004
-1.8%
1 ene 1987 año
54.792
+0.131
0.24%
1 ene 1988 año
52.326
-2.466
-4.5%
1 ene 1989 año
59.994
+7.668
14.65%
1 ene 1990 año
62.874
+2.881
4.8%
1 ene 1991 año
63.734
+0.859
1.37%
1 ene 1992 año
64.443
+0.709
1.11%
1 ene 1993 año
65.217
+0.774
1.2%
1 ene 1994 año
63.653
-1.564
-2.4%
1 ene 1995 año
64.705
+1.052
1.65%
1 ene 1996 año
63.162
-1.542
-2.38%
1 ene 1997 año
60.592
-2.571
-4.07%
1 ene 1998 año
61.055
+0.464
0.76%
1 ene 1999 año
61.991
+0.936
1.53%
1 ene 2000 año
61.983
-0.008
-0.01%
1 ene 2001 año
61.607
-0.377
-0.61%
1 ene 2002 año
63.309
+1.703
2.76%
1 ene 2003 año
63.547
+0.238
0.38%
1 ene 2004 año
62.702
-0.846
-1.33%
1 ene 2005 año
61.046
-1.656
-2.64%
1 ene 2006 año
61.457
+0.411
0.67%
1 ene 2007 año
60.376
-1.081
-1.76%
1 ene 2008 año
60.58
+0.204
0.34%
1 ene 2009 año
60.153
-0.427
-0.7%
1 ene 2010 año
62.187
+2.034
3.38%
1 ene 2011 año
61.453
-0.734
-1.18%
1 ene 2012 año
60.326
-1.128
-1.84%
1 ene 2013 año
60.128
-0.197
-0.33%
1 ene 2014 año
62.073
+1.944
3.23%
1 ene 2015 año
62.138
+0.065
0.1%
1 ene 2016 año
63.615
+1.478
2.38%
Ranking de los países por los datos estadísticos actuales


Comentarios: