29
/es/
es
AIzaSyAYiBZKx7MnpbEhh9jyipgxe19OcubqV5w
April 1, 2024
59363
Sub-Saharan Africa
SSF
false
2
1
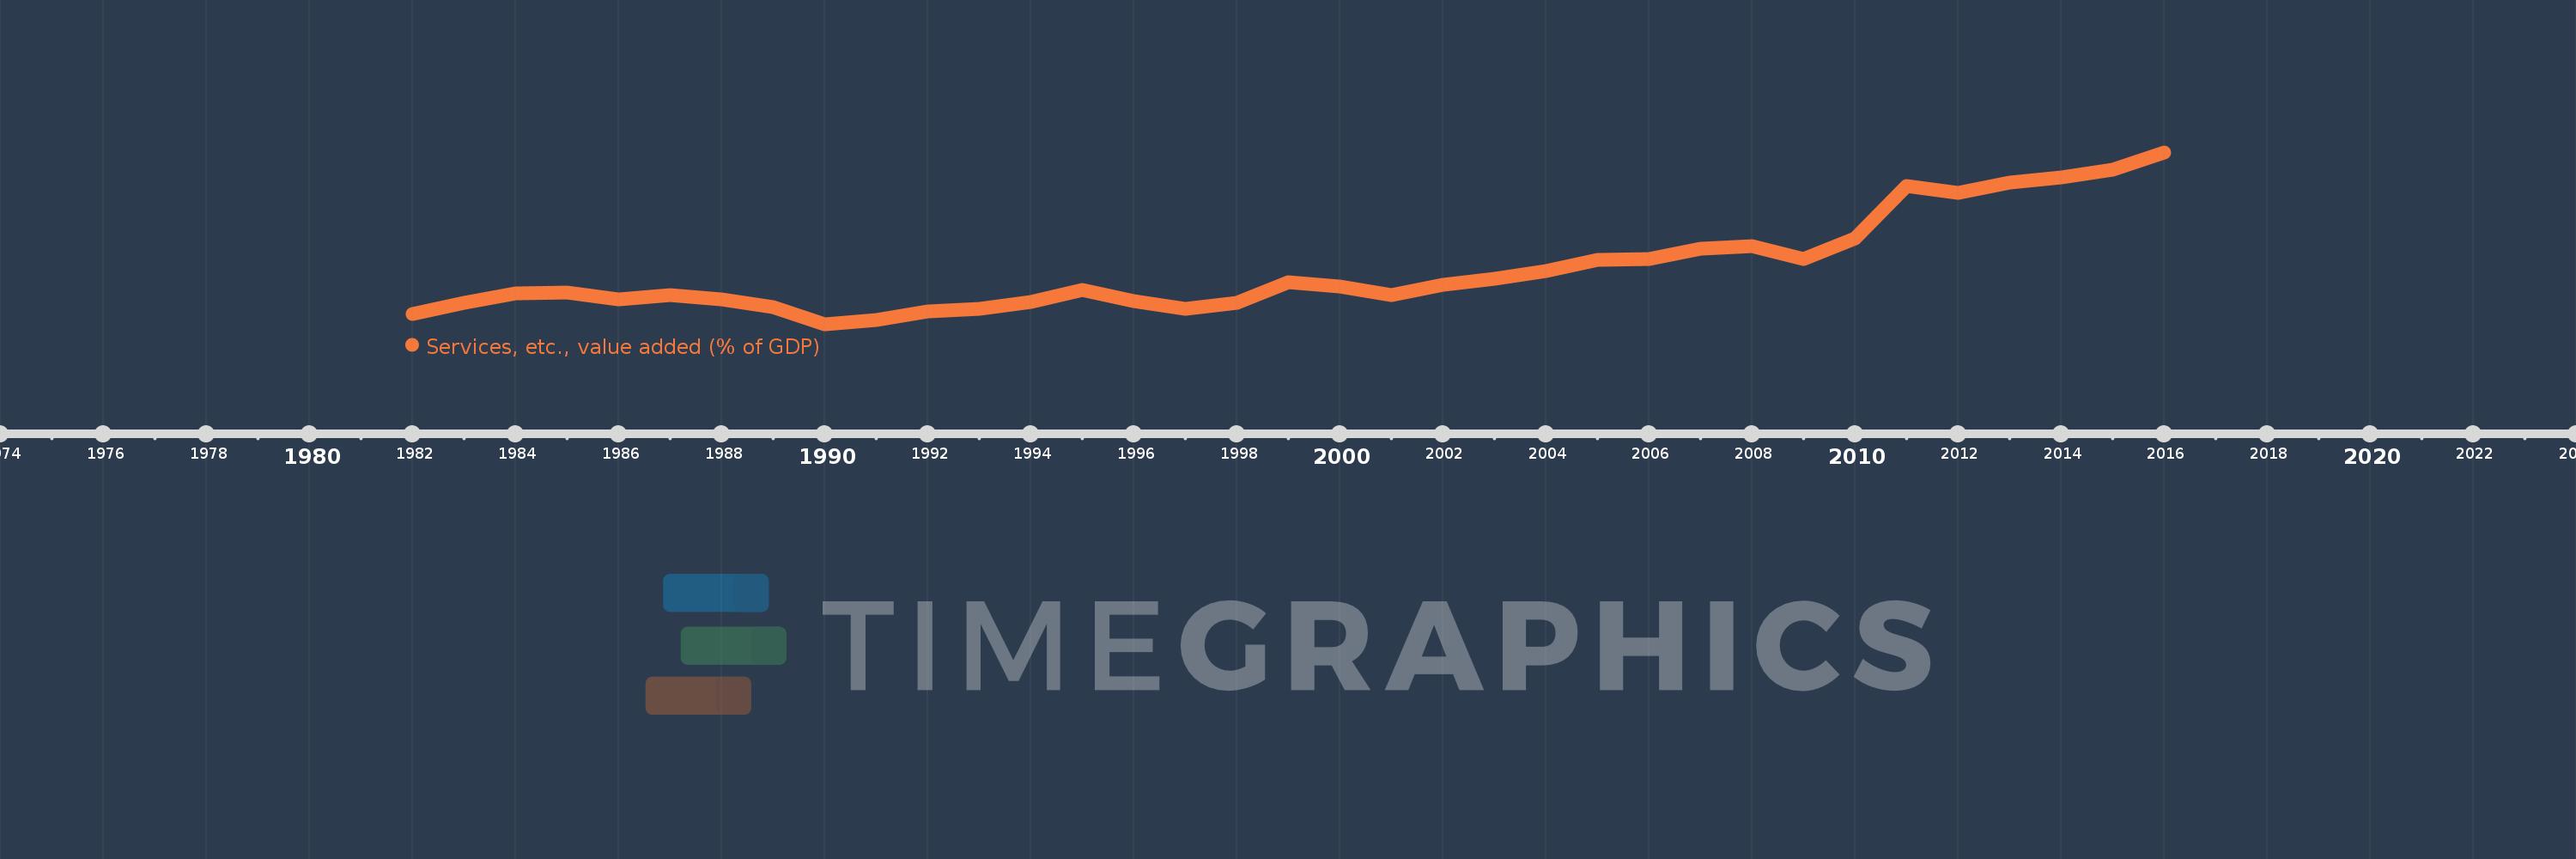
Services, etc., value added (% of GDP)
2016,2015,2014,2013,2012,2011,2010,2009,2008,2007,2006,2005,2004,2003,2002,2001,2000,1999,1998,1997,1996,1995,1994,1993,1992,1991,1990,1989,1988,1987,1986,1985,1984,1983,1982
Estas estadísticas en otros países:
AfghanistanAlbaniaAlgeriaAndorraAngolaAntigua and BarbudaArab WorldArgentinaArmeniaArubaAustraliaAustriaAzerbaijanBahamas, TheBahrainBangladeshBarbadosBelarusBelgiumBelizeBeninBermudaBhutanBoliviaBosnia and HerzegovinaBotswanaBrazilBrunei DarussalamBulgariaBurkina FasoBurundiCabo VerdeCambodiaCameroonCanadaCaribbean small statesCentral African RepublicCentral Europe and the BalticsChadChileChinaColombiaComorosCongo, Dem. Rep.Congo, Rep.Costa RicaCote d'IvoireCroatiaCubaCyprusCzech RepublicDenmarkDjiboutiDominicaDominican RepublicEarly-demographic dividendEast Asia & PacificEast Asia & Pacific (excluding high income)East Asia & Pacific (IDA & IBRD countries)EcuadorEgypt, Arab Rep.El SalvadorEquatorial GuineaEritreaEstoniaEthiopiaEuro areaEurope & Central AsiaEurope & Central Asia (excluding high income)Europe & Central Asia (IDA & IBRD countries)European UnionFaroe IslandsFijiFinlandFragile and conflict affected situationsFranceGabonGambia, TheGeorgiaGermanyGhanaGreeceGrenadaGuatemalaGuineaGuinea-BissauGuyanaHeavily indebted poor countries (HIPC)High incomeHondurasHong Kong SAR, ChinaHungaryIBRD onlyIcelandIDA & IBRD totalIDA blendIDA onlyIDA totalIndiaIndonesiaIran, Islamic Rep.IrelandItalyJamaicaJapanJordanKazakhstanKenyaKiribatiKorea, Rep.KosovoKuwaitKyrgyz RepublicLao PDRLate-demographic dividendLatin America & Caribbean Latin America & Caribbean (excluding high income)Latin America & the Caribbean (IDA & IBRD countries)LatviaLeast developed countries: UN classificationLebanonLesothoLibyaLithuaniaLow & middle incomeLow incomeLower middle incomeLuxembourgMacao SAR, ChinaMacedonia, FYRMadagascarMalawiMalaysiaMaldivesMaliMaltaMarshall IslandsMauritaniaMauritiusMexicoMicronesia, Fed. Sts.Middle East & North AfricaMiddle East & North Africa (excluding high income)Middle East & North Africa (IDA & IBRD countries)Middle incomeMoldovaMongoliaMontenegroMoroccoMozambiqueMyanmarNamibiaNepalNetherlandsNew CaledoniaNew ZealandNicaraguaNigerNigeriaNorth AmericaNorwayOECD membersOmanOther small statesPacific island small statesPakistanPalauPanamaPapua New GuineaParaguayPeruPhilippinesPolandPortugalPost-demographic dividendPre-demographic dividendPuerto RicoQatarRomaniaRussian FederationRwandaSao Tome and PrincipeSaudi ArabiaSenegalSerbiaSeychellesSierra LeoneSingaporeSlovak RepublicSloveniaSmall statesSolomon IslandsSomaliaSouth AfricaSouth AsiaSouth Asia (IDA & IBRD)SpainSri LankaSt. Kitts and NevisSt. LuciaSt. Vincent and the GrenadinesSub-Saharan Africa Sub-Saharan Africa (excluding high income)Sub-Saharan Africa (IDA & IBRD countries)SudanSurinameSwazilandSwedenSwitzerlandSyrian Arab RepublicTajikistanTanzaniaThailandTimor-LesteTogoTongaTrinidad and TobagoTunisiaTurkeyTurkmenistanTuvaluUgandaUkraineUnited KingdomUnited StatesUpper middle incomeUruguayUzbekistanVanuatuVenezuela, RBVietnamWest Bank and GazaWorldYemen, Rep.ZambiaZimbabwe línea de tiempo (timeline):
En esta escala de tiempo se presenta un gráfico de 1982 y 2016 de Sub-Saharan Africa . Los datos de 1981 están ausentes. El número de observaciones reales por fecha: 35.
Fuente (nombre):
Indicadores del desarrollo mundial
Fuente (organización):
World Bank national accounts data, and OECD National Accounts data files.
Categorías:
Economy & Growth
Se ha actualizado:
23 abr 2017 año
Los indicadores de los cambios de valor en los últimos años
Mínimo:
41.387
1 ene 1990 año
Máximo:
57.876
1 ene 2016 año
A la fecha de observación
Valor
Cambio absoluto
El cambio con respecto al valor anterior
1 ene 1982 año
42.384
+42.384
0.0%
1 ene 1983 año
43.416
+1.032
2.44%
1 ene 1984 año
44.337
+0.921
2.12%
1 ene 1985 año
44.451
+0.114
0.26%
1 ene 1986 año
43.799
-0.652
-1.47%
1 ene 1987 año
44.209
+0.41
0.94%
1 ene 1988 año
43.778
-0.431
-0.98%
1 ene 1989 año
43.033
-0.745
-1.7%
1 ene 1990 año
41.387
-1.645
-3.82%
1 ene 1991 año
41.792
+0.404
0.98%
1 ene 1992 año
42.586
+0.794
1.9%
1 ene 1993 año
42.829
+0.243
0.57%
1 ene 1994 año
43.545
+0.716
1.67%
1 ene 1995 año
44.684
+1.14
2.62%
1 ene 1996 año
43.57
-1.114
-2.49%
1 ene 1997 año
42.835
-0.735
-1.69%
1 ene 1998 año
43.406
+0.571
1.33%
1 ene 1999 año
45.426
+2.02
4.65%
1 ene 2000 año
44.986
-0.441
-0.97%
1 ene 2001 año
44.19
-0.796
-1.77%
1 ene 2002 año
45.154
+0.964
2.18%
1 ene 2003 año
45.758
+0.605
1.34%
1 ene 2004 año
46.526
+0.768
1.68%
1 ene 2005 año
47.559
+1.033
2.22%
1 ene 2006 año
47.618
+0.058
0.12%
1 ene 2007 año
48.596
+0.978
2.05%
1 ene 2008 año
48.892
+0.296
0.61%
1 ene 2009 año
47.626
-1.266
-2.59%
1 ene 2010 año
49.593
+1.966
4.13%
1 ene 2011 año
54.65
+5.057
10.2%
1 ene 2012 año
53.991
-0.659
-1.21%
1 ene 2013 año
54.954
+0.964
1.78%
1 ene 2014 año
55.452
+0.498
0.91%
1 ene 2015 año
56.248
+0.796
1.43%
1 ene 2016 año
57.876
+1.628
2.89%
Ranking de los países por los datos estadísticos actuales


Comentarios: