29
/es/
es
AIzaSyAYiBZKx7MnpbEhh9jyipgxe19OcubqV5w
April 1, 2024
84770
Benin
BEN
true
2
1
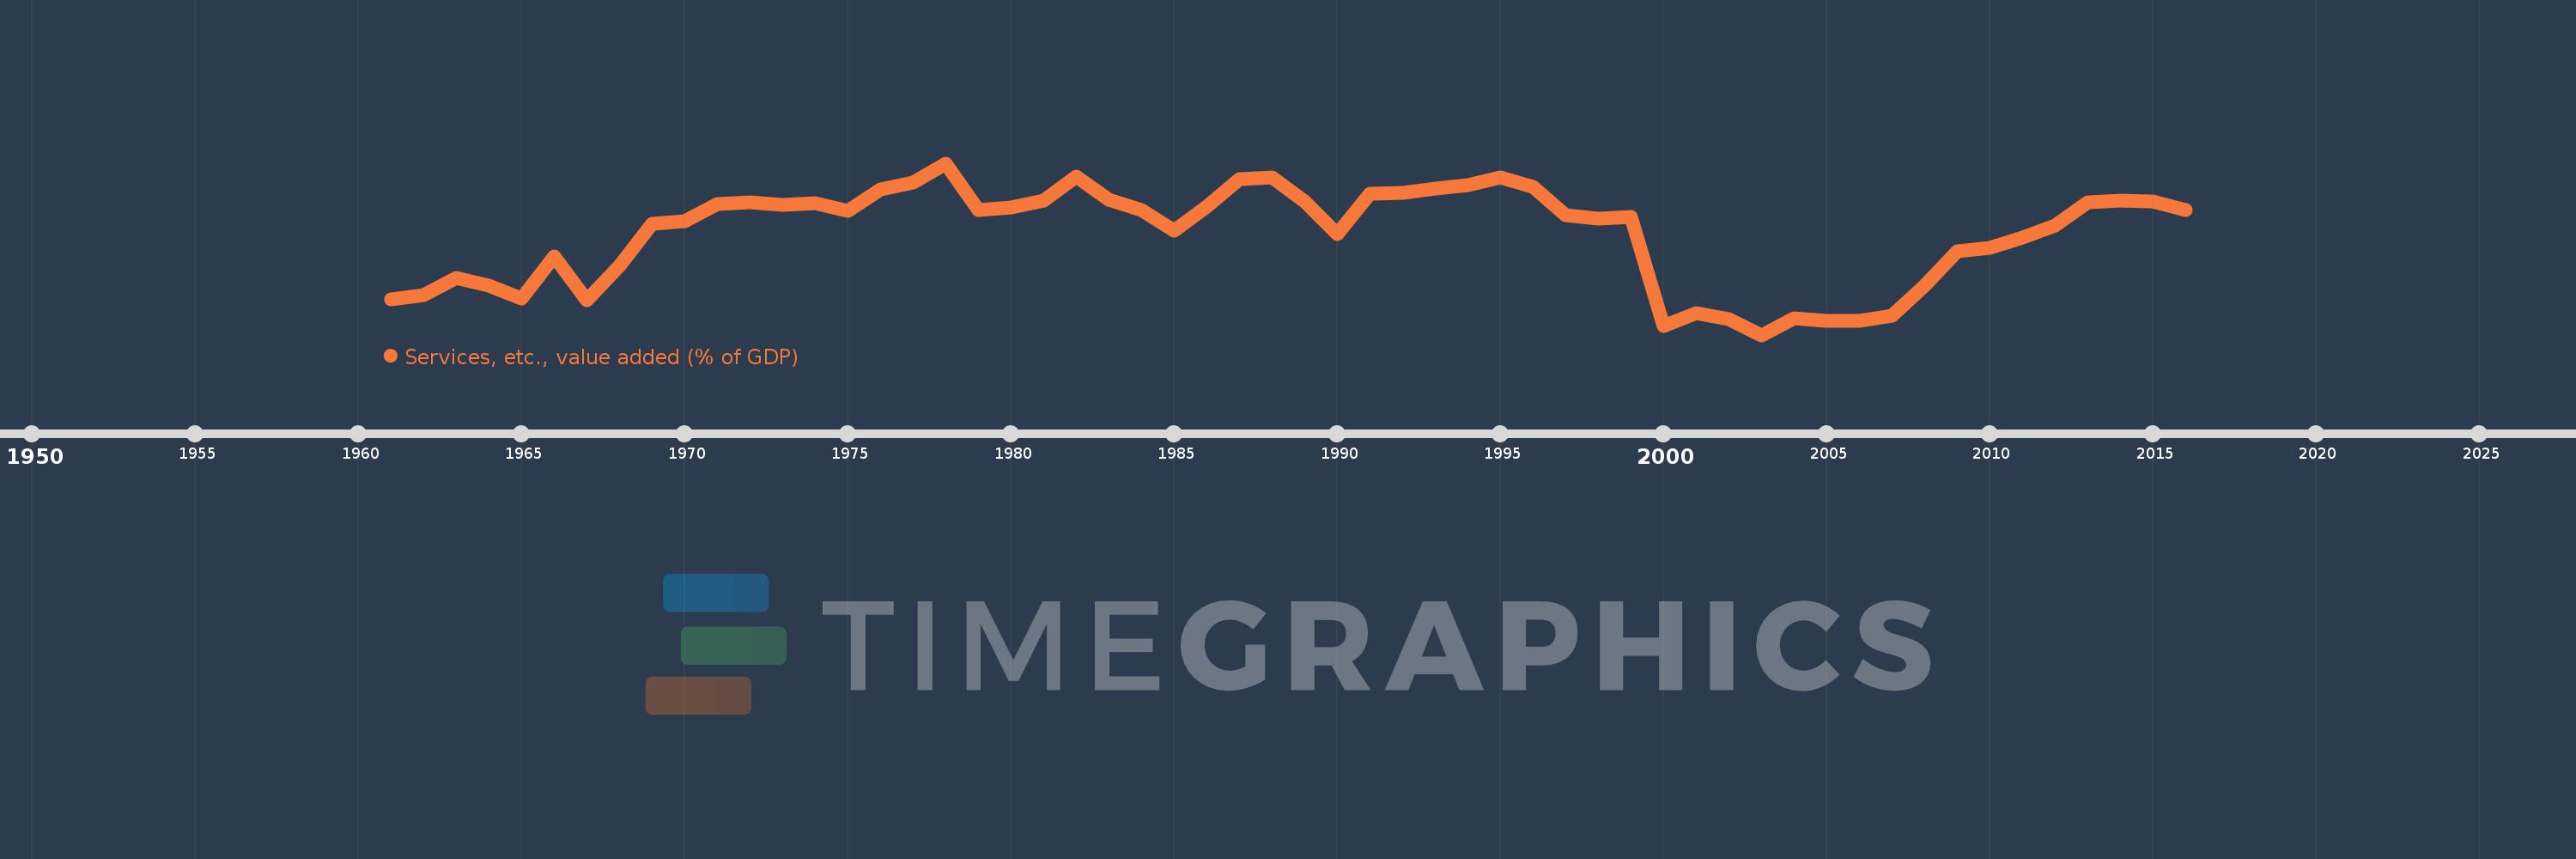
Services, etc., value added (% of GDP)
2016,2015,2014,2013,2012,2011,2010,2009,2008,2007,2006,2005,2004,2003,2002,2001,2000,1999,1998,1997,1996,1995,1994,1993,1992,1991,1990,1989,1988,1987,1986,1985,1984,1983,1982,1981,1980,1979,1978,1977,1976,1975,1974,1973,1972,1971,1970,1969,1968,1967,1966,1965,1964,1963,1962,1961
Estas estadísticas en otros países:
AfghanistanAlbaniaAlgeriaAndorraAngolaAntigua and BarbudaArab WorldArgentinaArmeniaArubaAustraliaAustriaAzerbaijanBahamas, TheBahrainBangladeshBarbadosBelarusBelgiumBelizeBeninBermudaBhutanBoliviaBosnia and HerzegovinaBotswanaBrazilBrunei DarussalamBulgariaBurkina FasoBurundiCabo VerdeCambodiaCameroonCanadaCaribbean small statesCentral African RepublicCentral Europe and the BalticsChadChileChinaColombiaComorosCongo, Dem. Rep.Congo, Rep.Costa RicaCote d'IvoireCroatiaCubaCyprusCzech RepublicDenmarkDjiboutiDominicaDominican RepublicEarly-demographic dividendEast Asia & PacificEast Asia & Pacific (excluding high income)East Asia & Pacific (IDA & IBRD countries)EcuadorEgypt, Arab Rep.El SalvadorEquatorial GuineaEritreaEstoniaEthiopiaEuro areaEurope & Central AsiaEurope & Central Asia (excluding high income)Europe & Central Asia (IDA & IBRD countries)European UnionFaroe IslandsFijiFinlandFragile and conflict affected situationsFranceGabonGambia, TheGeorgiaGermanyGhanaGreeceGrenadaGuatemalaGuineaGuinea-BissauGuyanaHeavily indebted poor countries (HIPC)High incomeHondurasHong Kong SAR, ChinaHungaryIBRD onlyIcelandIDA & IBRD totalIDA blendIDA onlyIDA totalIndiaIndonesiaIran, Islamic Rep.IrelandItalyJamaicaJapanJordanKazakhstanKenyaKiribatiKorea, Rep.KosovoKuwaitKyrgyz RepublicLao PDRLate-demographic dividendLatin America & Caribbean Latin America & Caribbean (excluding high income)Latin America & the Caribbean (IDA & IBRD countries)LatviaLeast developed countries: UN classificationLebanonLesothoLibyaLithuaniaLow & middle incomeLow incomeLower middle incomeLuxembourgMacao SAR, ChinaMacedonia, FYRMadagascarMalawiMalaysiaMaldivesMaliMaltaMarshall IslandsMauritaniaMauritiusMexicoMicronesia, Fed. Sts.Middle East & North AfricaMiddle East & North Africa (excluding high income)Middle East & North Africa (IDA & IBRD countries)Middle incomeMoldovaMongoliaMontenegroMoroccoMozambiqueMyanmarNamibiaNepalNetherlandsNew CaledoniaNew ZealandNicaraguaNigerNigeriaNorth AmericaNorwayOECD membersOmanOther small statesPacific island small statesPakistanPalauPanamaPapua New GuineaParaguayPeruPhilippinesPolandPortugalPost-demographic dividendPre-demographic dividendPuerto RicoQatarRomaniaRussian FederationRwandaSao Tome and PrincipeSaudi ArabiaSenegalSerbiaSeychellesSierra LeoneSingaporeSlovak RepublicSloveniaSmall statesSolomon IslandsSomaliaSouth AfricaSouth AsiaSouth Asia (IDA & IBRD)SpainSri LankaSt. Kitts and NevisSt. LuciaSt. Vincent and the GrenadinesSub-Saharan Africa Sub-Saharan Africa (excluding high income)Sub-Saharan Africa (IDA & IBRD countries)SudanSurinameSwazilandSwedenSwitzerlandSyrian Arab RepublicTajikistanTanzaniaThailandTimor-LesteTogoTongaTrinidad and TobagoTunisiaTurkeyTurkmenistanTuvaluUgandaUkraineUnited KingdomUnited StatesUpper middle incomeUruguayUzbekistanVanuatuVenezuela, RBVietnamWest Bank and GazaWorldYemen, Rep.ZambiaZimbabwe línea de tiempo (timeline):
En esta escala de tiempo se presenta un gráfico de 1961 y 2016 de Benin. Los datos de 1960 están ausentes. El número de observaciones reales por fecha: 56.
Fuente (nombre):
Indicadores del desarrollo mundial
Fuente (organización):
World Bank national accounts data, and OECD National Accounts data files.
Categorías:
Economy & Growth
Se ha actualizado:
23 abr 2017 año
Los indicadores de los cambios de valor en los últimos años
Mínimo:
40.445
1 ene 2003 año
Máximo:
55.588
1 ene 1978 año
A la fecha de observación
Valor
Cambio absoluto
El cambio con respecto al valor anterior
1 ene 1961 año
43.615
+43.615
0.0%
1 ene 1962 año
43.993
+0.378
0.87%
1 ene 1963 año
45.499
+1.507
3.42%
1 ene 1964 año
44.812
-0.687
-1.51%
1 ene 1965 año
43.678
-1.134
-2.53%
1 ene 1966 año
47.399
+3.72
8.52%
1 ene 1967 año
43.546
-3.853
-8.13%
1 ene 1968 año
46.506
+2.96
6.8%
1 ene 1969 año
50.263
+3.757
8.08%
1 ene 1970 año
50.44
+0.177
0.35%
1 ene 1971 año
51.968
+1.528
3.03%
1 ene 1972 año
52.161
+0.193
0.37%
1 ene 1973 año
51.881
-0.281
-0.54%
1 ene 1974 año
52.08
+0.199
0.38%
1 ene 1975 año
51.382
-0.698
-1.34%
1 ene 1976 año
53.297
+1.915
3.73%
1 ene 1977 año
53.893
+0.596
1.12%
1 ene 1978 año
55.588
+1.694
3.14%
1 ene 1979 año
51.452
-4.135
-7.44%
1 ene 1980 año
51.664
+0.211
0.41%
1 ene 1981 año
52.286
+0.622
1.2%
1 ene 1982 año
54.425
+2.139
4.09%
1 ene 1983 año
52.376
-2.049
-3.76%
1 ene 1984 año
51.485
-0.891
-1.7%
1 ene 1985 año
49.619
-1.866
-3.63%
1 ene 1986 año
51.752
+2.133
4.3%
1 ene 1987 año
54.221
+2.469
4.77%
1 ene 1988 año
54.354
+0.133
0.25%
1 ene 1989 año
52.225
-2.129
-3.92%
1 ene 1990 año
49.375
-2.85
-5.46%
1 ene 1991 año
52.892
+3.517
7.12%
1 ene 1992 año
52.974
+0.082
0.15%
1 ene 1993 año
53.33
+0.357
0.67%
1 ene 1994 año
53.663
+0.333
0.62%
1 ene 1995 año
54.368
+0.705
1.31%
1 ene 1996 año
53.518
-0.85
-1.56%
1 ene 1997 año
51.028
-2.49
-4.65%
1 ene 1998 año
50.697
-0.33
-0.65%
1 ene 1999 año
50.857
+0.16
0.31%
1 ene 2000 año
41.265
-9.592
-18.86%
1 ene 2001 año
42.383
+1.118
2.71%
1 ene 2002 año
41.837
-0.546
-1.29%
1 ene 2003 año
40.445
-1.391
-3.33%
1 ene 2004 año
41.904
+1.459
3.61%
1 ene 2005 año
41.694
-0.211
-0.5%
1 ene 2006 año
41.684
-0.01
-0.02%
1 ene 2007 año
42.132
+0.448
1.08%
1 ene 2008 año
44.809
+2.677
6.35%
1 ene 2009 año
47.857
+3.048
6.8%
1 ene 2010 año
48.138
+0.28
0.59%
1 ene 2011 año
49.018
+0.88
1.83%
1 ene 2012 año
50.126
+1.109
2.26%
1 ene 2013 año
52.173
+2.047
4.08%
1 ene 2014 año
52.317
+0.144
0.28%
1 ene 2015 año
52.205
-0.113
-0.22%
1 ene 2016 año
51.442
-0.763
-1.46%
Ranking de los países por los datos estadísticos actuales


Comentarios: