29
/es/
es
AIzaSyAYiBZKx7MnpbEhh9jyipgxe19OcubqV5w
April 1, 2024
143567
Grenada
GRD
true
2
1
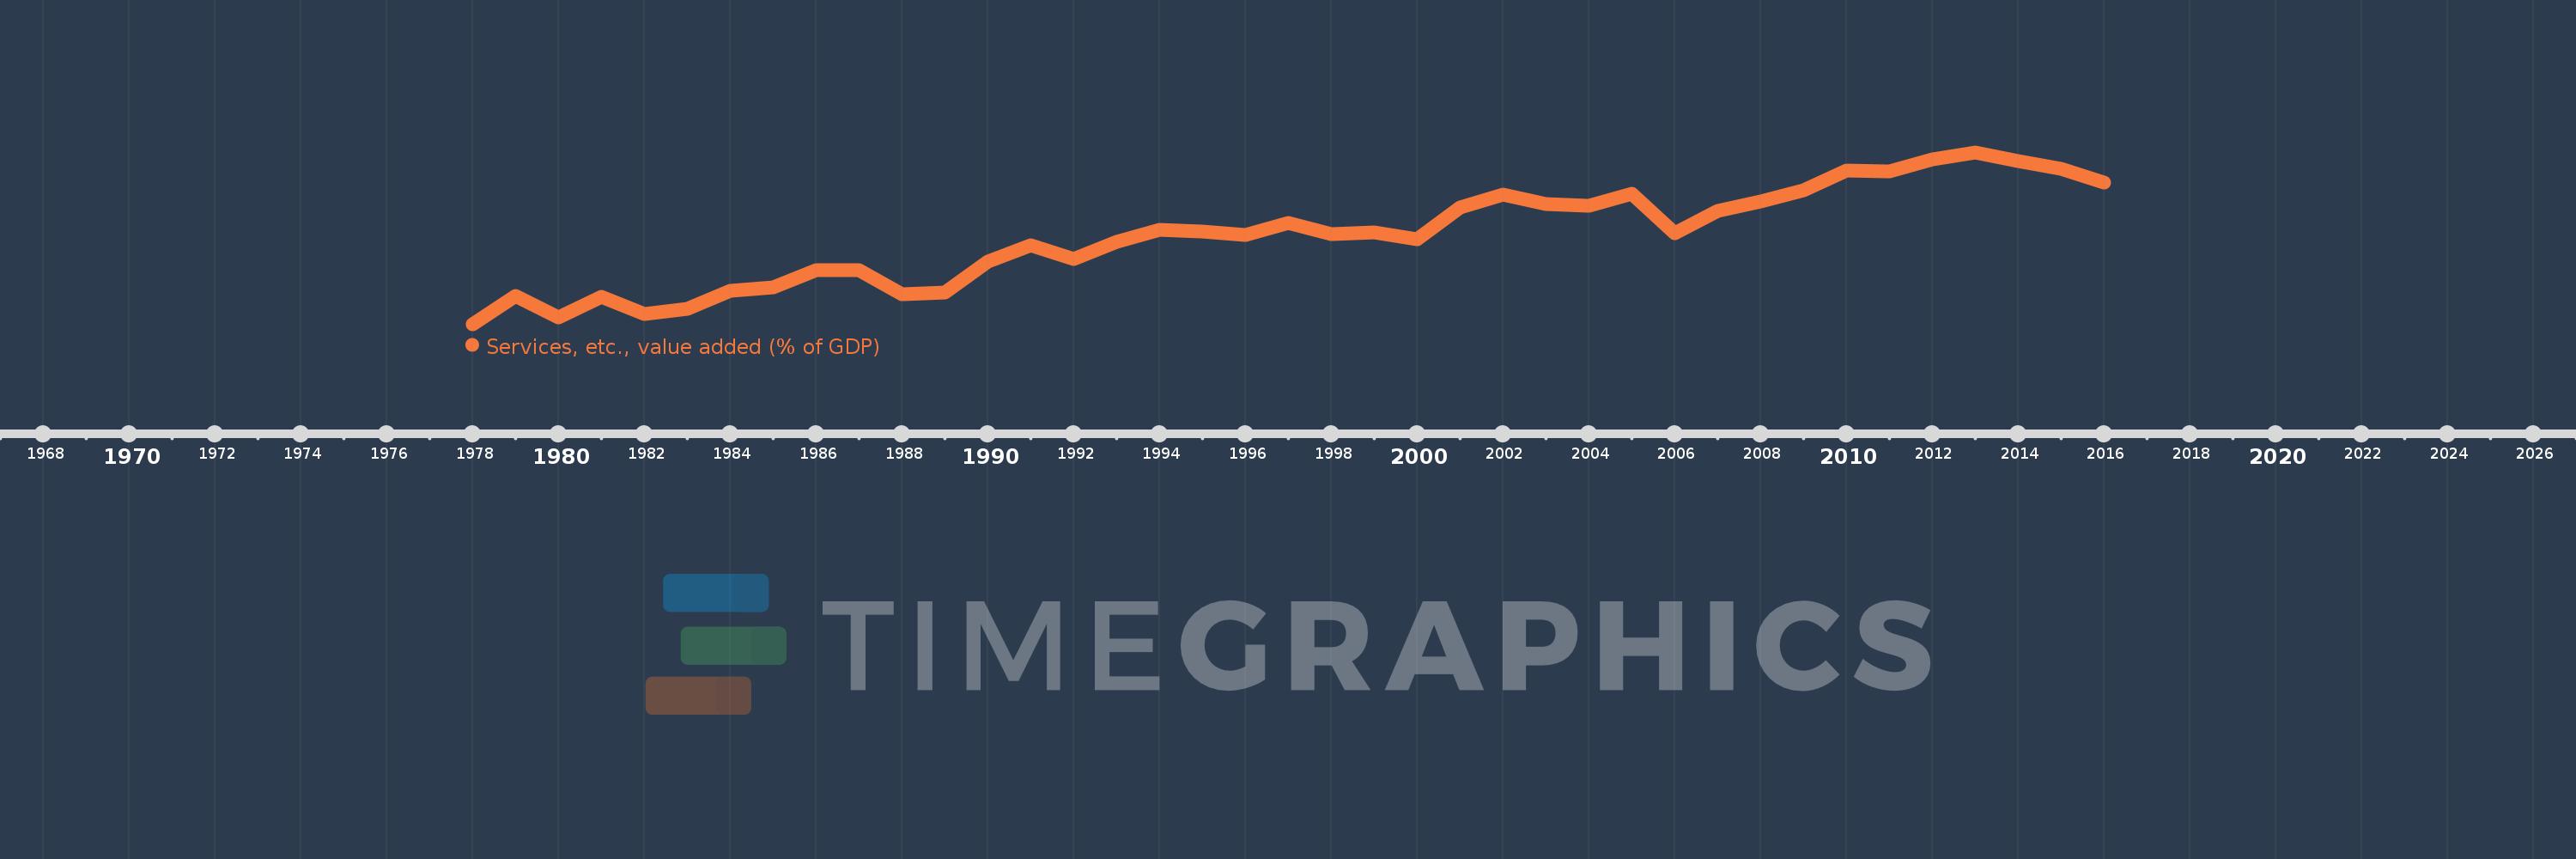
Services, etc., value added (% of GDP)
2016,2015,2014,2013,2012,2011,2010,2009,2008,2007,2006,2005,2004,2003,2002,2001,2000,1999,1998,1997,1996,1995,1994,1993,1992,1991,1990,1989,1988,1987,1986,1985,1984,1983,1982,1981,1980,1979,1978
Estas estadísticas en otros países:
AfghanistanAlbaniaAlgeriaAndorraAngolaAntigua and BarbudaArab WorldArgentinaArmeniaArubaAustraliaAustriaAzerbaijanBahamas, TheBahrainBangladeshBarbadosBelarusBelgiumBelizeBeninBermudaBhutanBoliviaBosnia and HerzegovinaBotswanaBrazilBrunei DarussalamBulgariaBurkina FasoBurundiCabo VerdeCambodiaCameroonCanadaCaribbean small statesCentral African RepublicCentral Europe and the BalticsChadChileChinaColombiaComorosCongo, Dem. Rep.Congo, Rep.Costa RicaCote d'IvoireCroatiaCubaCyprusCzech RepublicDenmarkDjiboutiDominicaDominican RepublicEarly-demographic dividendEast Asia & PacificEast Asia & Pacific (excluding high income)East Asia & Pacific (IDA & IBRD countries)EcuadorEgypt, Arab Rep.El SalvadorEquatorial GuineaEritreaEstoniaEthiopiaEuro areaEurope & Central AsiaEurope & Central Asia (excluding high income)Europe & Central Asia (IDA & IBRD countries)European UnionFaroe IslandsFijiFinlandFragile and conflict affected situationsFranceGabonGambia, TheGeorgiaGermanyGhanaGreeceGrenadaGuatemalaGuineaGuinea-BissauGuyanaHeavily indebted poor countries (HIPC)High incomeHondurasHong Kong SAR, ChinaHungaryIBRD onlyIcelandIDA & IBRD totalIDA blendIDA onlyIDA totalIndiaIndonesiaIran, Islamic Rep.IrelandItalyJamaicaJapanJordanKazakhstanKenyaKiribatiKorea, Rep.KosovoKuwaitKyrgyz RepublicLao PDRLate-demographic dividendLatin America & Caribbean Latin America & Caribbean (excluding high income)Latin America & the Caribbean (IDA & IBRD countries)LatviaLeast developed countries: UN classificationLebanonLesothoLibyaLithuaniaLow & middle incomeLow incomeLower middle incomeLuxembourgMacao SAR, ChinaMacedonia, FYRMadagascarMalawiMalaysiaMaldivesMaliMaltaMarshall IslandsMauritaniaMauritiusMexicoMicronesia, Fed. Sts.Middle East & North AfricaMiddle East & North Africa (excluding high income)Middle East & North Africa (IDA & IBRD countries)Middle incomeMoldovaMongoliaMontenegroMoroccoMozambiqueMyanmarNamibiaNepalNetherlandsNew CaledoniaNew ZealandNicaraguaNigerNigeriaNorth AmericaNorwayOECD membersOmanOther small statesPacific island small statesPakistanPalauPanamaPapua New GuineaParaguayPeruPhilippinesPolandPortugalPost-demographic dividendPre-demographic dividendPuerto RicoQatarRomaniaRussian FederationRwandaSao Tome and PrincipeSaudi ArabiaSenegalSerbiaSeychellesSierra LeoneSingaporeSlovak RepublicSloveniaSmall statesSolomon IslandsSomaliaSouth AfricaSouth AsiaSouth Asia (IDA & IBRD)SpainSri LankaSt. Kitts and NevisSt. LuciaSt. Vincent and the GrenadinesSub-Saharan Africa Sub-Saharan Africa (excluding high income)Sub-Saharan Africa (IDA & IBRD countries)SudanSurinameSwazilandSwedenSwitzerlandSyrian Arab RepublicTajikistanTanzaniaThailandTimor-LesteTogoTongaTrinidad and TobagoTunisiaTurkeyTurkmenistanTuvaluUgandaUkraineUnited KingdomUnited StatesUpper middle incomeUruguayUzbekistanVanuatuVenezuela, RBVietnamWest Bank and GazaWorldYemen, Rep.ZambiaZimbabwe línea de tiempo (timeline):
En esta escala de tiempo se presenta un gráfico de 1978 y 2016 de Grenada. Los datos de 1977 están ausentes. El número de observaciones reales por fecha: 39.
Fuente (nombre):
Indicadores del desarrollo mundial
Fuente (organización):
World Bank national accounts data, and OECD National Accounts data files.
Categorías:
Economy & Growth
Se ha actualizado:
23 abr 2017 año
Los indicadores de los cambios de valor en los últimos años
Mínimo:
58.698
1 ene 1978 año
Máximo:
80.128
1 ene 2013 año
A la fecha de observación
Valor
Cambio absoluto
El cambio con respecto al valor anterior
1 ene 1978 año
58.698
+58.698
0.0%
1 ene 1979 año
62.275
+3.577
6.09%
1 ene 1980 año
59.571
-2.704
-4.34%
1 ene 1981 año
62.155
+2.584
4.34%
1 ene 1982 año
59.94
-2.215
-3.56%
1 ene 1983 año
60.592
+0.651
1.09%
1 ene 1984 año
62.814
+2.222
3.67%
1 ene 1985 año
63.344
+0.53
0.84%
1 ene 1986 año
65.448
+2.104
3.32%
1 ene 1987 año
65.465
+0.017
0.03%
1 ene 1988 año
62.415
-3.05
-4.66%
1 ene 1989 año
62.668
+0.253
0.41%
1 ene 1990 año
66.553
+3.885
6.2%
1 ene 1991 año
68.597
+2.044
3.07%
1 ene 1992 año
66.81
-1.787
-2.6%
1 ene 1993 año
68.934
+2.123
3.18%
1 ene 1994 año
70.458
+1.524
2.21%
1 ene 1995 año
70.274
-0.184
-0.26%
1 ene 1996 año
69.856
-0.419
-0.6%
1 ene 1997 año
71.348
+1.492
2.14%
1 ene 1998 año
69.989
-1.358
-1.9%
1 ene 1999 año
70.198
+0.209
0.3%
1 ene 2000 año
69.246
-0.952
-1.36%
1 ene 2001 año
73.253
+4.007
5.79%
1 ene 2002 año
74.876
+1.622
2.21%
1 ene 2003 año
73.663
-1.212
-1.62%
1 ene 2004 año
73.476
-0.187
-0.25%
1 ene 2005 año
75.004
+1.528
2.08%
1 ene 2006 año
70.088
-4.916
-6.55%
1 ene 2007 año
72.881
+2.793
3.98%
1 ene 2008 año
74.011
+1.13
1.55%
1 ene 2009 año
75.415
+1.404
1.9%
1 ene 2010 año
77.917
+2.503
3.32%
1 ene 2011 año
77.735
-0.182
-0.23%
1 ene 2012 año
79.265
+1.531
1.97%
1 ene 2013 año
80.128
+0.863
1.09%
1 ene 2014 año
79.043
-1.086
-1.36%
1 ene 2015 año
78.103
-0.939
-1.19%
1 ene 2016 año
76.374
-1.729
-2.21%
Ranking de los países por los datos estadísticos actuales


Comentarios: