29
/es/
es
AIzaSyAYiBZKx7MnpbEhh9jyipgxe19OcubqV5w
April 1, 2024
276135
United Kingdom
GBR
true
2
1
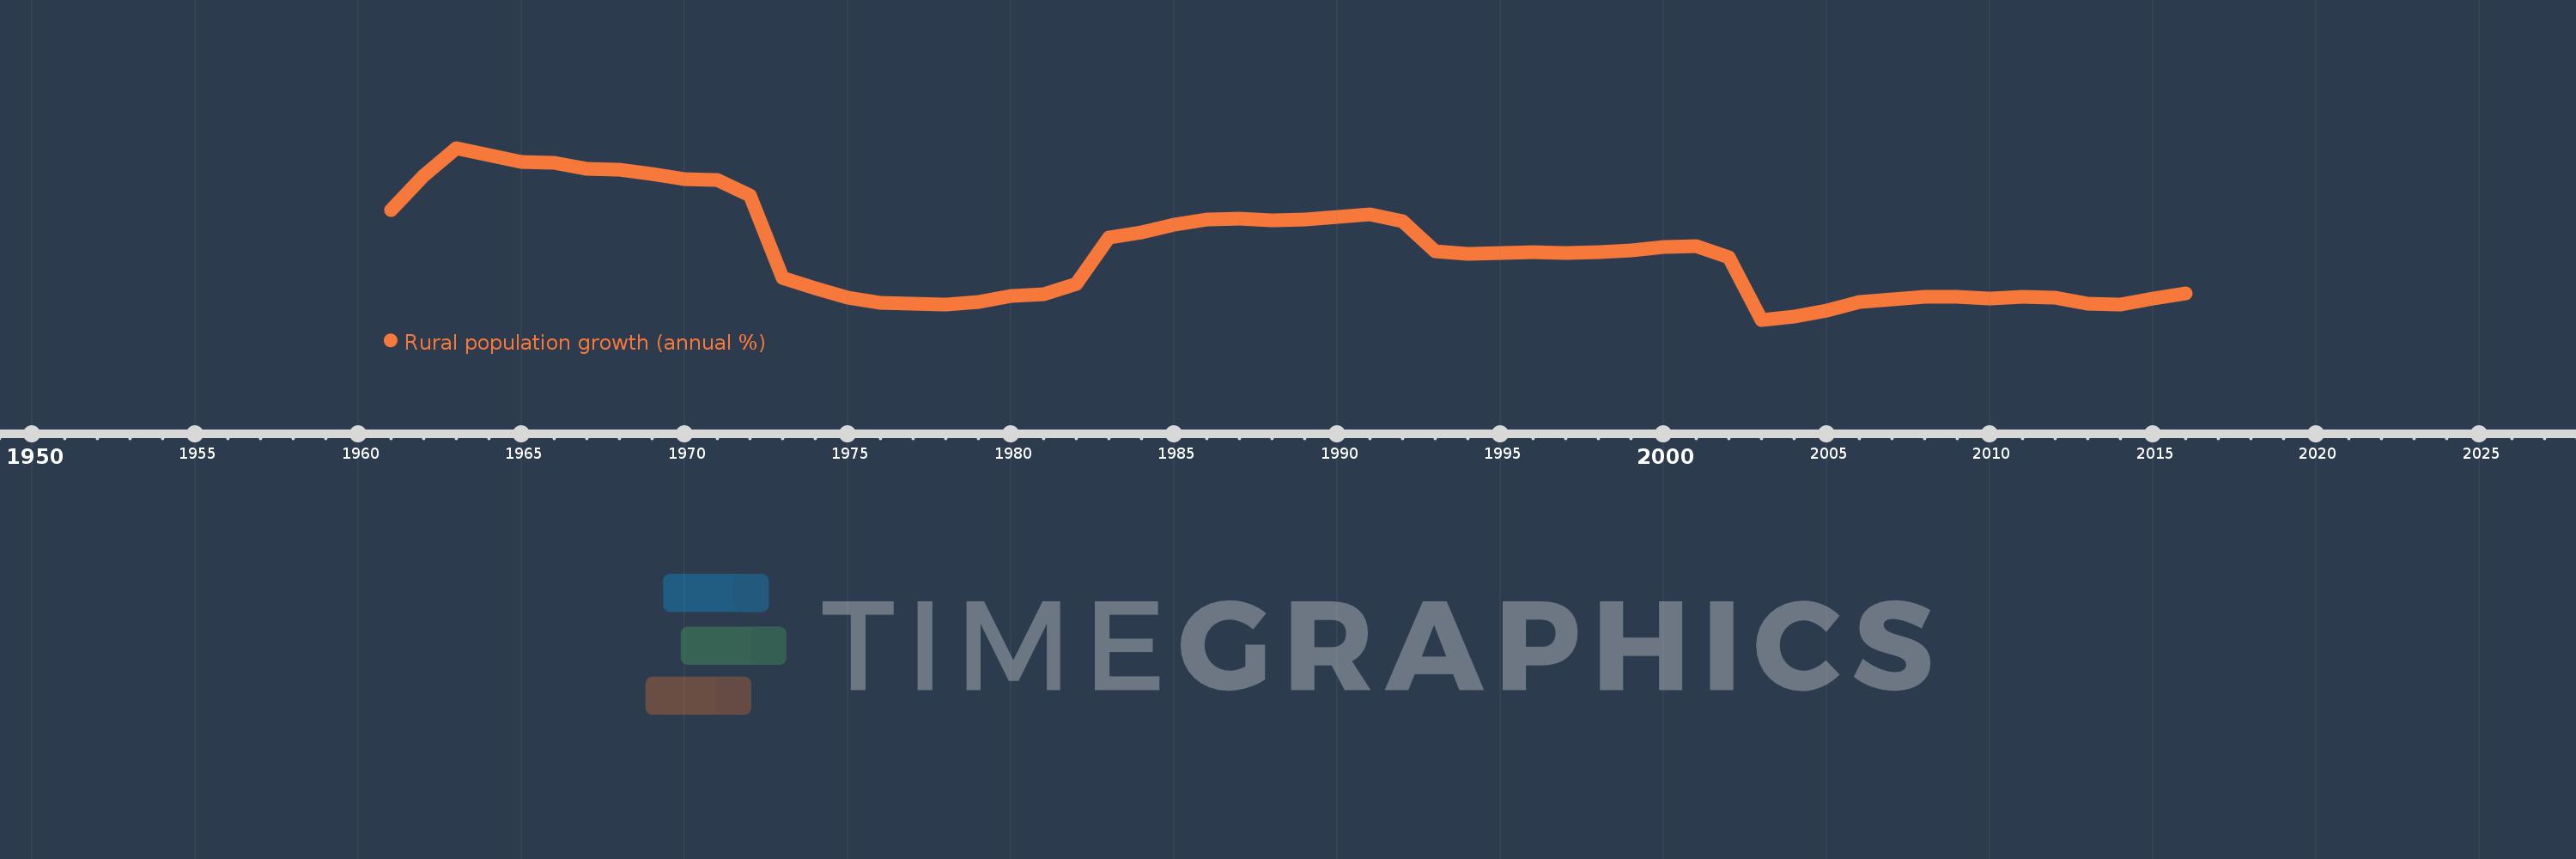
Rural population growth (annual %)
2016,2015,2014,2013,2012,2011,2010,2009,2008,2007,2006,2005,2004,2003,2002,2001,2000,1999,1998,1997,1996,1995,1994,1993,1992,1991,1990,1989,1988,1987,1986,1985,1984,1983,1982,1981,1980,1979,1978,1977,1976,1975,1974,1973,1972,1971,1970,1969,1968,1967,1966,1965,1964,1963,1962,1961
Estas estadísticas en otros países:
AfghanistanAlbaniaAlgeriaAmerican SamoaAndorraAngolaAntigua and BarbudaArab WorldArgentinaArmeniaArubaAustraliaAustriaAzerbaijanBahamas, TheBahrainBangladeshBarbadosBelarusBelgiumBelizeBeninBhutanBoliviaBosnia and HerzegovinaBotswanaBrazilBritish Virgin IslandsBrunei DarussalamBulgariaBurkina FasoBurundiCabo VerdeCambodiaCameroonCanadaCaribbean small statesCentral African RepublicCentral Europe and the BalticsChadChannel IslandsChileChinaColombiaComorosCongo, Dem. Rep.Congo, Rep.Costa RicaCote d'IvoireCroatiaCubaCuracaoCyprusCzech RepublicDenmarkDjiboutiDominicaDominican RepublicEarly-demographic dividendEast Asia & PacificEast Asia & Pacific (excluding high income)East Asia & Pacific (IDA & IBRD countries)EcuadorEgypt, Arab Rep.El SalvadorEquatorial GuineaEritreaEstoniaEthiopiaEuro areaEurope & Central AsiaEurope & Central Asia (excluding high income)Europe & Central Asia (IDA & IBRD countries)European UnionFaroe IslandsFijiFinlandFragile and conflict affected situationsFranceFrench PolynesiaGabonGambia, TheGeorgiaGermanyGhanaGreeceGreenlandGrenadaGuamGuatemalaGuineaGuinea-BissauGuyanaHaitiHeavily indebted poor countries (HIPC)High incomeHondurasHong Kong SAR, ChinaHungaryIBRD onlyIcelandIDA & IBRD totalIDA blendIDA onlyIDA totalIndiaIndonesiaIran, Islamic Rep.IraqIrelandIsle of ManIsraelItalyJamaicaJapanJordanKazakhstanKenyaKiribatiKorea, Dem. People’s Rep.Korea, Rep.KuwaitKyrgyz RepublicLao PDRLate-demographic dividendLatin America & Caribbean Latin America & Caribbean (excluding high income)Latin America & the Caribbean (IDA & IBRD countries)LatviaLeast developed countries: UN classificationLebanonLesothoLiberiaLibyaLiechtensteinLithuaniaLow & middle incomeLow incomeLower middle incomeLuxembourgMacao SAR, ChinaMacedonia, FYRMadagascarMalawiMalaysiaMaldivesMaliMaltaMarshall IslandsMauritaniaMauritiusMexicoMicronesia, Fed. Sts.Middle East & North AfricaMiddle East & North Africa (excluding high income)Middle East & North Africa (IDA & IBRD countries)Middle incomeMoldovaMongoliaMontenegroMoroccoMozambiqueMyanmarNamibiaNauruNepalNetherlandsNew CaledoniaNew ZealandNicaraguaNigerNigeriaNorth AmericaNorthern Mariana IslandsNorwayOECD membersOmanOther small statesPacific island small statesPakistanPalauPanamaPapua New GuineaParaguayPeruPhilippinesPolandPortugalPost-demographic dividendPre-demographic dividendPuerto RicoQatarRomaniaRussian FederationRwandaSamoaSan MarinoSao Tome and PrincipeSaudi ArabiaSenegalSerbiaSeychellesSierra LeoneSlovak RepublicSloveniaSmall statesSolomon IslandsSomaliaSouth AfricaSouth AsiaSouth Asia (IDA & IBRD)South SudanSpainSri LankaSt. Kitts and NevisSt. LuciaSt. Vincent and the GrenadinesSub-Saharan Africa Sub-Saharan Africa (excluding high income)Sub-Saharan Africa (IDA & IBRD countries)SudanSurinameSwazilandSwedenSwitzerlandSyrian Arab RepublicTajikistanTanzaniaThailandTimor-LesteTogoTongaTrinidad and TobagoTunisiaTurkeyTurkmenistanTurks and Caicos IslandsTuvaluUgandaUkraineUnited Arab EmiratesUnited KingdomUnited StatesUpper middle incomeUruguayUzbekistanVanuatuVenezuela, RBVietnamVirgin Islands (U.S.)West Bank and GazaWorldYemen, Rep.ZambiaZimbabwe línea de tiempo (timeline):
En esta escala de tiempo se presenta un gráfico de 1961 y 2016 de United Kingdom. Los datos de 1960 están ausentes. El número de observaciones reales por fecha: 56.
Fuente (nombre):
Indicadores del desarrollo mundial
Fuente (organización):
World Bank Staff estimates based on United Nations, World Urbanization Prospects.
Categorías:
Agriculture & Rural Development
Se ha actualizado:
23 abr 2017 año
Los indicadores de los cambios de valor en los últimos años
Mínimo:
-0.979
1 ene 2003 año
Máximo:
1.48
1 ene 1963 año
A la fecha de observación
Valor
Cambio absoluto
El cambio con respecto al valor anterior
1 ene 1961 año
0.597
+0.597
0.0%
1 ene 1962 año
1.085
+0.488
81.7%
1 ene 1963 año
1.48
+0.395
36.46%
1 ene 1964 año
1.38
-0.1
-6.74%
1 ene 1965 año
1.283
-0.098
-7.06%
1 ene 1966 año
1.271
-0.012
-0.92%
1 ene 1967 año
1.176
-0.095
-7.48%
1 ene 1968 año
1.168
-0.008
-0.66%
1 ene 1969 año
1.113
-0.056
-4.77%
1 ene 1970 año
1.038
-0.075
-6.73%
1 ene 1971 año
1.021
-0.017
-1.6%
1 ene 1972 año
0.797
-0.224
-21.94%
1 ene 1973 año
-0.382
-1.179
-147.9%
1 ene 1974 año
-0.524
-0.142
37.25%
1 ene 1975 año
-0.659
-0.135
25.82%
1 ene 1976 año
-0.731
-0.071
10.81%
1 ene 1977 año
-0.749
-0.018
2.45%
1 ene 1978 año
-0.762
-0.014
1.81%
1 ene 1979 año
-0.72
+0.042
-5.51%
1 ene 1980 año
-0.641
+0.079
-10.98%
1 ene 1981 año
-0.612
+0.029
-4.53%
1 ene 1982 año
-0.464
+0.148
-24.24%
1 ene 1983 año
0.193
+0.656
-141.57%
1 ene 1984 año
0.267
+0.074
38.43%
1 ene 1985 año
0.386
+0.119
44.59%
1 ene 1986 año
0.459
+0.073
18.87%
1 ene 1987 año
0.463
+0.004
0.9%
1 ene 1988 año
0.443
-0.019
-4.21%
1 ene 1989 año
0.452
+0.009
2.01%
1 ene 1990 año
0.49
+0.038
8.34%
1 ene 1991 año
0.528
+0.038
7.78%
1 ene 1992 año
0.437
-0.091
-17.17%
1 ene 1993 año
-0.004
-0.441
-100.93%
1 ene 1994 año
-0.036
-0.031
773.36%
1 ene 1995 año
-0.026
+0.009
-26.67%
1 ene 1996 año
-0.012
+0.014
-52.97%
1 ene 1997 año
-0.023
-0.011
87.29%
1 ene 1998 año
-0.016
+0.007
-29.67%
1 ene 1999 año
0.012
+0.028
-176.3%
1 ene 2000 año
0.058
+0.046
372.97%
1 ene 2001 año
0.077
+0.018
31.7%
1 ene 2002 año
-0.085
-0.161
-210.28%
1 ene 2003 año
-0.979
-0.895
1.06 mil%
1 ene 2004 año
-0.938
+0.042
-4.26%
1 ene 2005 año
-0.845
+0.093
-9.93%
1 ene 2006 año
-0.727
+0.117
-13.89%
1 ene 2007 año
-0.689
+0.038
-5.26%
1 ene 2008 año
-0.645
+0.044
-6.32%
1 ene 2009 año
-0.647
-0.002
0.28%
1 ene 2010 año
-0.678
-0.03
4.7%
1 ene 2011 año
-0.655
+0.023
-3.35%
1 ene 2012 año
-0.662
-0.007
1.06%
1 ene 2013 año
-0.747
-0.085
12.92%
1 ene 2014 año
-0.761
-0.013
1.79%
1 ene 2015 año
-0.67
+0.091
-12.01%
1 ene 2016 año
-0.6
+0.07
-10.45%
Ranking de los países por los datos estadísticos actuales


Comentarios: