29
/es/
es
AIzaSyAYiBZKx7MnpbEhh9jyipgxe19OcubqV5w
April 1, 2024
227851
Qatar
QAT
true
2
1
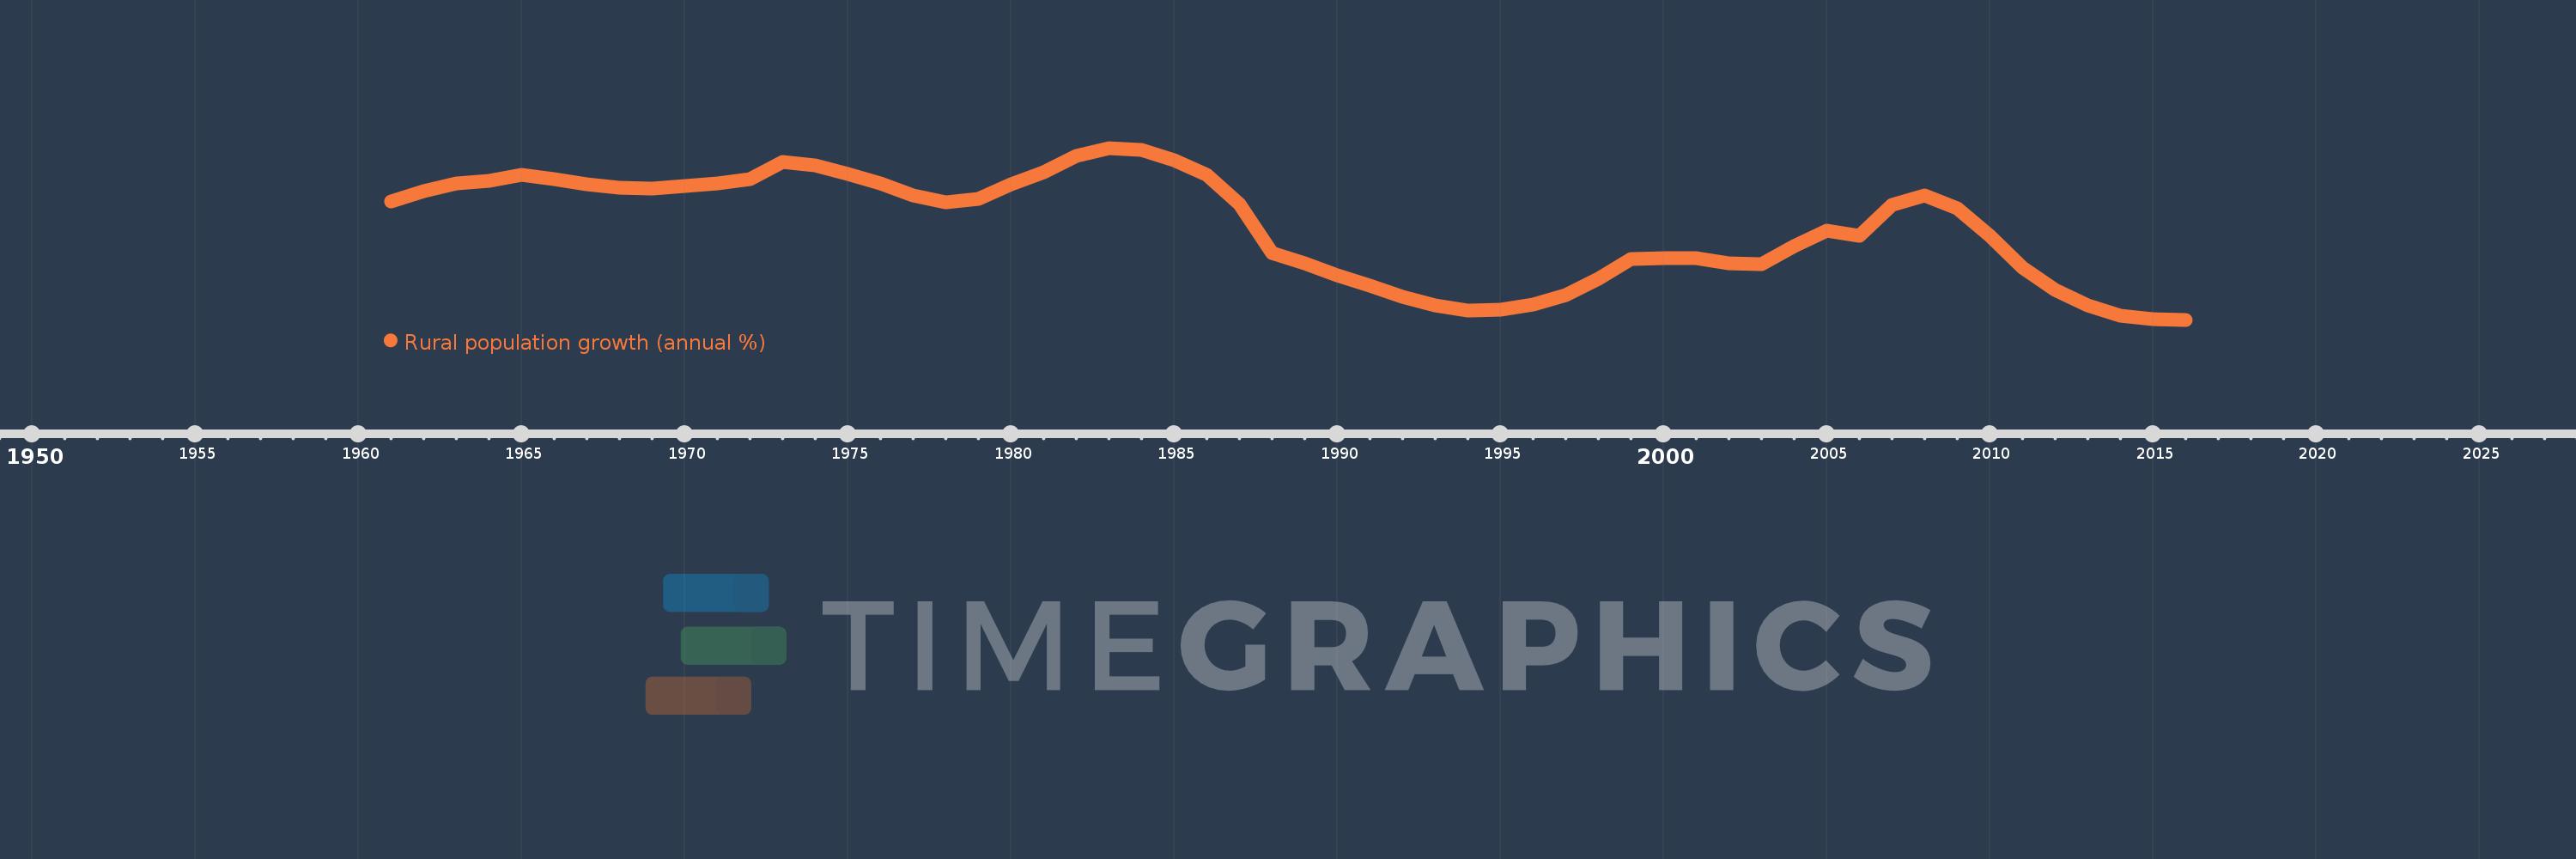
Rural population growth (annual %)
2016,2015,2014,2013,2012,2011,2010,2009,2008,2007,2006,2005,2004,2003,2002,2001,2000,1999,1998,1997,1996,1995,1994,1993,1992,1991,1990,1989,1988,1987,1986,1985,1984,1983,1982,1981,1980,1979,1978,1977,1976,1975,1974,1973,1972,1971,1970,1969,1968,1967,1966,1965,1964,1963,1962,1961
Estas estadísticas en otros países:
AfghanistanAlbaniaAlgeriaAmerican SamoaAndorraAngolaAntigua and BarbudaArab WorldArgentinaArmeniaArubaAustraliaAustriaAzerbaijanBahamas, TheBahrainBangladeshBarbadosBelarusBelgiumBelizeBeninBhutanBoliviaBosnia and HerzegovinaBotswanaBrazilBritish Virgin IslandsBrunei DarussalamBulgariaBurkina FasoBurundiCabo VerdeCambodiaCameroonCanadaCaribbean small statesCentral African RepublicCentral Europe and the BalticsChadChannel IslandsChileChinaColombiaComorosCongo, Dem. Rep.Congo, Rep.Costa RicaCote d'IvoireCroatiaCubaCuracaoCyprusCzech RepublicDenmarkDjiboutiDominicaDominican RepublicEarly-demographic dividendEast Asia & PacificEast Asia & Pacific (excluding high income)East Asia & Pacific (IDA & IBRD countries)EcuadorEgypt, Arab Rep.El SalvadorEquatorial GuineaEritreaEstoniaEthiopiaEuro areaEurope & Central AsiaEurope & Central Asia (excluding high income)Europe & Central Asia (IDA & IBRD countries)European UnionFaroe IslandsFijiFinlandFragile and conflict affected situationsFranceFrench PolynesiaGabonGambia, TheGeorgiaGermanyGhanaGreeceGreenlandGrenadaGuamGuatemalaGuineaGuinea-BissauGuyanaHaitiHeavily indebted poor countries (HIPC)High incomeHondurasHong Kong SAR, ChinaHungaryIBRD onlyIcelandIDA & IBRD totalIDA blendIDA onlyIDA totalIndiaIndonesiaIran, Islamic Rep.IraqIrelandIsle of ManIsraelItalyJamaicaJapanJordanKazakhstanKenyaKiribatiKorea, Dem. People’s Rep.Korea, Rep.KuwaitKyrgyz RepublicLao PDRLate-demographic dividendLatin America & Caribbean Latin America & Caribbean (excluding high income)Latin America & the Caribbean (IDA & IBRD countries)LatviaLeast developed countries: UN classificationLebanonLesothoLiberiaLibyaLiechtensteinLithuaniaLow & middle incomeLow incomeLower middle incomeLuxembourgMacao SAR, ChinaMacedonia, FYRMadagascarMalawiMalaysiaMaldivesMaliMaltaMarshall IslandsMauritaniaMauritiusMexicoMicronesia, Fed. Sts.Middle East & North AfricaMiddle East & North Africa (excluding high income)Middle East & North Africa (IDA & IBRD countries)Middle incomeMoldovaMongoliaMontenegroMoroccoMozambiqueMyanmarNamibiaNauruNepalNetherlandsNew CaledoniaNew ZealandNicaraguaNigerNigeriaNorth AmericaNorthern Mariana IslandsNorwayOECD membersOmanOther small statesPacific island small statesPakistanPalauPanamaPapua New GuineaParaguayPeruPhilippinesPolandPortugalPost-demographic dividendPre-demographic dividendPuerto RicoQatarRomaniaRussian FederationRwandaSamoaSan MarinoSao Tome and PrincipeSaudi ArabiaSenegalSerbiaSeychellesSierra LeoneSlovak RepublicSloveniaSmall statesSolomon IslandsSomaliaSouth AfricaSouth AsiaSouth Asia (IDA & IBRD)South SudanSpainSri LankaSt. Kitts and NevisSt. LuciaSt. Vincent and the GrenadinesSub-Saharan Africa Sub-Saharan Africa (excluding high income)Sub-Saharan Africa (IDA & IBRD countries)SudanSurinameSwazilandSwedenSwitzerlandSyrian Arab RepublicTajikistanTanzaniaThailandTimor-LesteTogoTongaTrinidad and TobagoTunisiaTurkeyTurkmenistanTurks and Caicos IslandsTuvaluUgandaUkraineUnited Arab EmiratesUnited KingdomUnited StatesUpper middle incomeUruguayUzbekistanVanuatuVenezuela, RBVietnamVirgin Islands (U.S.)West Bank and GazaWorldYemen, Rep.ZambiaZimbabwe línea de tiempo (timeline):
En esta escala de tiempo se presenta un gráfico de 1961 y 2016 de Qatar. Los datos de 1960 están ausentes. El número de observaciones reales por fecha: 56.
Fuente (nombre):
Indicadores del desarrollo mundial
Fuente (organización):
World Bank Staff estimates based on United Nations, World Urbanization Prospects.
Categorías:
Agriculture & Rural Development
Se ha actualizado:
23 abr 2017 año
Los indicadores de los cambios de valor en los últimos años
Mínimo:
-7.784
1 ene 2016 año
Máximo:
9.695
1 ene 1983 año
A la fecha de observación
Valor
Cambio absoluto
El cambio con respecto al valor anterior
1 ene 1961 año
4.237
+4.237
0.0%
1 ene 1962 año
5.325
+1.088
25.67%
1 ene 1963 año
6.098
+0.773
14.52%
1 ene 1964 año
6.363
+0.264
4.33%
1 ene 1965 año
6.962
+0.599
9.42%
1 ene 1966 año
6.498
-0.464
-6.66%
1 ene 1967 año
5.983
-0.515
-7.93%
1 ene 1968 año
5.636
-0.347
-5.8%
1 ene 1969 año
5.574
-0.062
-1.09%
1 ene 1970 año
5.782
+0.208
3.73%
1 ene 1971 año
6.088
+0.306
5.3%
1 ene 1972 año
6.551
+0.463
7.61%
1 ene 1973 año
8.236
+1.685
25.72%
1 ene 1974 año
7.935
-0.301
-3.66%
1 ene 1975 año
7.084
-0.851
-10.73%
1 ene 1976 año
6.068
-1.016
-14.34%
1 ene 1977 año
4.893
-1.174
-19.36%
1 ene 1978 año
4.15
-0.743
-15.19%
1 ene 1979 año
4.47
+0.32
7.71%
1 ene 1980 año
5.968
+1.498
33.52%
1 ene 1981 año
7.19
+1.222
20.48%
1 ene 1982 año
8.896
+1.706
23.72%
1 ene 1983 año
9.695
+0.799
8.98%
1 ene 1984 año
9.49
-0.205
-2.11%
1 ene 1985 año
8.416
-1.074
-11.31%
1 ene 1986 año
6.922
-1.494
-17.75%
1 ene 1987 año
4.01
-2.913
-42.07%
1 ene 1988 año
-0.991
-5.001
-124.71%
1 ene 1989 año
-2.084
-1.094
110.37%
1 ene 1990 año
-3.234
-1.15
55.16%
1 ene 1991 año
-4.349
-1.115
34.49%
1 ene 1992 año
-5.462
-1.112
25.57%
1 ene 1993 año
-6.358
-0.897
16.42%
1 ene 1994 año
-6.818
-0.46
7.23%
1 ene 1995 año
-6.735
+0.084
-1.23%
1 ene 1996 año
-6.223
+0.512
-7.6%
1 ene 1997 año
-5.285
+0.938
-15.07%
1 ene 1998 año
-3.602
+1.683
-31.84%
1 ene 1999 año
-1.631
+1.971
-54.71%
1 ene 2000 año
-1.483
+0.149
-9.11%
1 ene 2001 año
-1.519
-0.036
2.43%
1 ene 2002 año
-2.072
-0.554
36.46%
1 ene 2003 año
-2.154
-0.082
3.96%
1 ene 2004 año
-0.282
+1.873
-86.93%
1 ene 2005 año
1.268
+1.549
-550.31%
1 ene 2006 año
0.733
-0.534
-42.15%
1 ene 2007 año
3.909
+3.175
432.96%
1 ene 2008 año
4.866
+0.957
24.49%
1 ene 2009 año
3.565
-1.301
-26.73%
1 ene 2010 año
0.788
-2.778
-77.91%
1 ene 2011 año
-2.491
-3.279
-416.29%
1 ene 2012 año
-4.783
-2.292
91.99%
1 ene 2013 año
-6.346
-1.564
32.69%
1 ene 2014 año
-7.393
-1.047
16.49%
1 ene 2015 año
-7.709
-0.316
4.28%
1 ene 2016 año
-7.784
-0.075
0.97%
Ranking de los países por los datos estadísticos actuales


Comentarios: