29
/es/
es
AIzaSyAYiBZKx7MnpbEhh9jyipgxe19OcubqV5w
April 1, 2024
238711
Seychelles
SYC
true
2
1
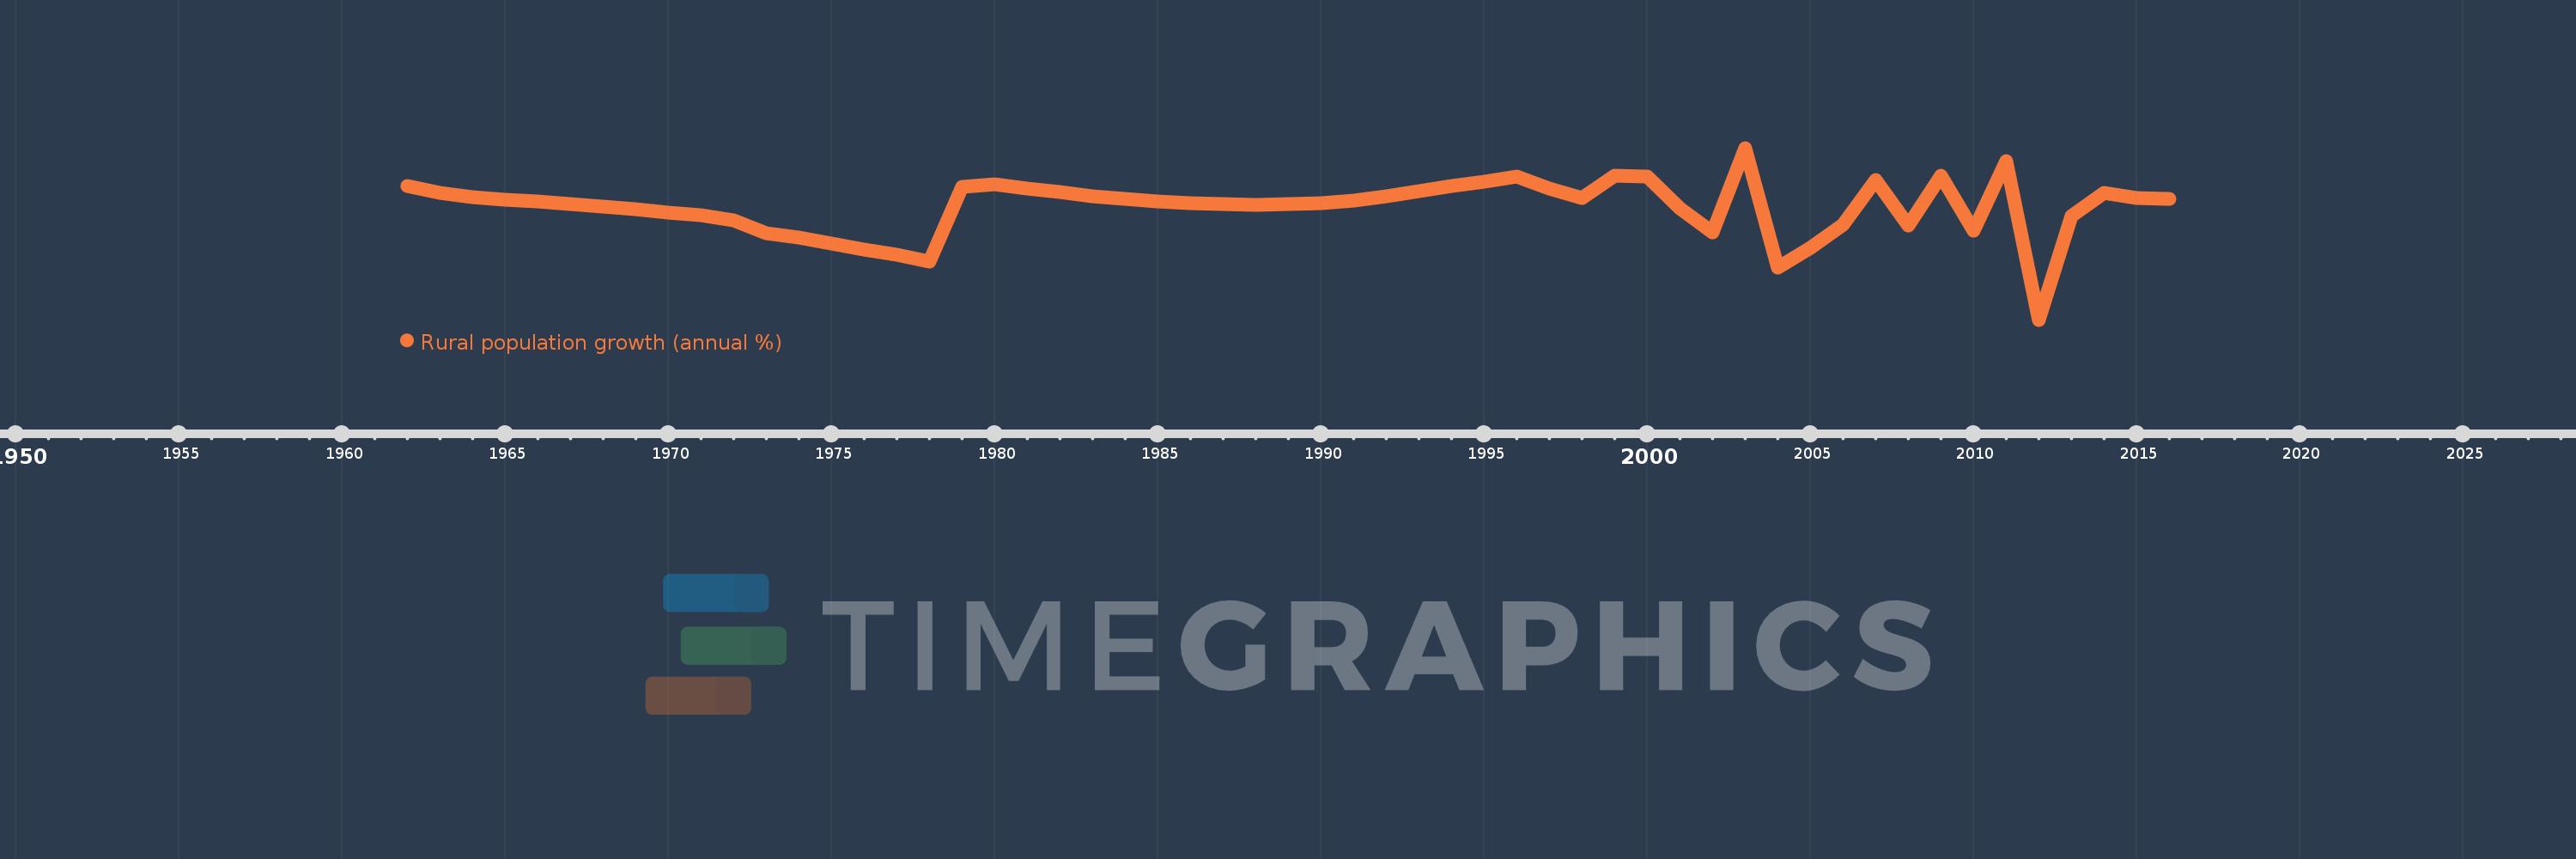
Rural population growth (annual %)
2016,2015,2014,2013,2012,2011,2010,2009,2008,2007,2006,2005,2004,2003,2002,2001,2000,1999,1998,1997,1996,1995,1994,1993,1992,1991,1990,1989,1988,1987,1986,1985,1984,1983,1982,1981,1980,1979,1978,1977,1976,1975,1974,1973,1972,1971,1970,1969,1968,1967,1966,1965,1964,1963,1962
Estas estadísticas en otros países:
AfghanistanAlbaniaAlgeriaAmerican SamoaAndorraAngolaAntigua and BarbudaArab WorldArgentinaArmeniaArubaAustraliaAustriaAzerbaijanBahamas, TheBahrainBangladeshBarbadosBelarusBelgiumBelizeBeninBhutanBoliviaBosnia and HerzegovinaBotswanaBrazilBritish Virgin IslandsBrunei DarussalamBulgariaBurkina FasoBurundiCabo VerdeCambodiaCameroonCanadaCaribbean small statesCentral African RepublicCentral Europe and the BalticsChadChannel IslandsChileChinaColombiaComorosCongo, Dem. Rep.Congo, Rep.Costa RicaCote d'IvoireCroatiaCubaCuracaoCyprusCzech RepublicDenmarkDjiboutiDominicaDominican RepublicEarly-demographic dividendEast Asia & PacificEast Asia & Pacific (excluding high income)East Asia & Pacific (IDA & IBRD countries)EcuadorEgypt, Arab Rep.El SalvadorEquatorial GuineaEritreaEstoniaEthiopiaEuro areaEurope & Central AsiaEurope & Central Asia (excluding high income)Europe & Central Asia (IDA & IBRD countries)European UnionFaroe IslandsFijiFinlandFragile and conflict affected situationsFranceFrench PolynesiaGabonGambia, TheGeorgiaGermanyGhanaGreeceGreenlandGrenadaGuamGuatemalaGuineaGuinea-BissauGuyanaHaitiHeavily indebted poor countries (HIPC)High incomeHondurasHong Kong SAR, ChinaHungaryIBRD onlyIcelandIDA & IBRD totalIDA blendIDA onlyIDA totalIndiaIndonesiaIran, Islamic Rep.IraqIrelandIsle of ManIsraelItalyJamaicaJapanJordanKazakhstanKenyaKiribatiKorea, Dem. People’s Rep.Korea, Rep.KuwaitKyrgyz RepublicLao PDRLate-demographic dividendLatin America & Caribbean Latin America & Caribbean (excluding high income)Latin America & the Caribbean (IDA & IBRD countries)LatviaLeast developed countries: UN classificationLebanonLesothoLiberiaLibyaLiechtensteinLithuaniaLow & middle incomeLow incomeLower middle incomeLuxembourgMacao SAR, ChinaMacedonia, FYRMadagascarMalawiMalaysiaMaldivesMaliMaltaMarshall IslandsMauritaniaMauritiusMexicoMicronesia, Fed. Sts.Middle East & North AfricaMiddle East & North Africa (excluding high income)Middle East & North Africa (IDA & IBRD countries)Middle incomeMoldovaMongoliaMontenegroMoroccoMozambiqueMyanmarNamibiaNauruNepalNetherlandsNew CaledoniaNew ZealandNicaraguaNigerNigeriaNorth AmericaNorthern Mariana IslandsNorwayOECD membersOmanOther small statesPacific island small statesPakistanPalauPanamaPapua New GuineaParaguayPeruPhilippinesPolandPortugalPost-demographic dividendPre-demographic dividendPuerto RicoQatarRomaniaRussian FederationRwandaSamoaSan MarinoSao Tome and PrincipeSaudi ArabiaSenegalSerbiaSeychellesSierra LeoneSlovak RepublicSloveniaSmall statesSolomon IslandsSomaliaSouth AfricaSouth AsiaSouth Asia (IDA & IBRD)South SudanSpainSri LankaSt. Kitts and NevisSt. LuciaSt. Vincent and the GrenadinesSub-Saharan Africa Sub-Saharan Africa (excluding high income)Sub-Saharan Africa (IDA & IBRD countries)SudanSurinameSwazilandSwedenSwitzerlandSyrian Arab RepublicTajikistanTanzaniaThailandTimor-LesteTogoTongaTrinidad and TobagoTunisiaTurkeyTurkmenistanTurks and Caicos IslandsTuvaluUgandaUkraineUnited Arab EmiratesUnited KingdomUnited StatesUpper middle incomeUruguayUzbekistanVanuatuVenezuela, RBVietnamVirgin Islands (U.S.)West Bank and GazaWorldYemen, Rep.ZambiaZimbabwe línea de tiempo (timeline):
En esta escala de tiempo se presenta un gráfico de 1962 y 2016 de Seychelles. Los datos de 1961 están ausentes. El número de observaciones reales por fecha: 55.
Fuente (nombre):
Indicadores del desarrollo mundial
Fuente (organización):
World Bank Staff estimates based on United Nations, World Urbanization Prospects.
Categorías:
Agriculture & Rural Development
Se ha actualizado:
23 abr 2017 año
Los indicadores de los cambios de valor en los últimos años
Mínimo:
-3.243
1 ene 2012 año
Máximo:
2.678
1 ene 2003 año
A la fecha de observación
Valor
Cambio absoluto
El cambio con respecto al valor anterior
1 ene 1962 año
1.36
+1.36
0.0%
1 ene 1963 año
1.142
-0.219
-16.07%
1 ene 1964 año
0.975
-0.166
-14.58%
1 ene 1965 año
0.88
-0.095
-9.75%
1 ene 1966 año
0.835
-0.045
-5.16%
1 ene 1967 año
0.75
-0.085
-10.18%
1 ene 1968 año
0.66
-0.089
-11.92%
1 ene 1969 año
0.557
-0.103
-15.61%
1 ene 1970 año
0.459
-0.098
-17.64%
1 ene 1971 año
0.347
-0.112
-24.47%
1 ene 1972 año
0.171
-0.175
-50.57%
1 ene 1973 año
-0.263
-0.435
-253.64%
1 ene 1974 año
-0.421
-0.158
59.85%
1 ene 1975 año
-0.617
-0.197
46.75%
1 ene 1976 año
-0.833
-0.216
34.98%
1 ene 1977 año
-1.011
-0.177
21.26%
1 ene 1978 año
-1.235
-0.224
22.17%
1 ene 1979 año
1.326
+2.561
-207.41%
1 ene 1980 año
1.436
+0.11
8.3%
1 ene 1981 año
1.287
-0.149
-10.38%
1 ene 1982 año
1.153
-0.135
-10.45%
1 ene 1983 año
1.025
-0.127
-11.03%
1 ene 1984 año
0.917
-0.108
-10.58%
1 ene 1985 año
0.835
-0.082
-8.94%
1 ene 1986 año
0.77
-0.065
-7.83%
1 ene 1987 año
0.735
-0.035
-4.54%
1 ene 1988 año
0.726
-0.008
-1.12%
1 ene 1989 año
0.753
+0.026
3.61%
1 ene 1990 año
0.784
+0.031
4.16%
1 ene 1991 año
0.854
+0.07
8.92%
1 ene 1992 año
1.025
+0.171
20.06%
1 ene 1993 año
1.188
+0.163
15.92%
1 ene 1994 año
1.357
+0.168
14.16%
1 ene 1995 año
1.526
+0.169
12.48%
1 ene 1996 año
1.69
+0.164
10.75%
1 ene 1997 año
1.283
-0.407
-24.06%
1 ene 1998 año
0.961
-0.322
-25.08%
1 ene 1999 año
1.716
+0.755
78.51%
1 ene 2000 año
1.7
-0.017
-0.96%
1 ene 2001 año
0.597
-1.102
-64.86%
1 ene 2002 año
-0.233
-0.83
-138.93%
1 ene 2003 año
2.678
+2.911
-1.25 mil%
1 ene 2004 año
-1.46
-4.138
-154.5%
1 ene 2005 año
-0.769
+0.691
-47.34%
1 ene 2006 año
0.047
+0.816
-106.09%
1 ene 2007 año
1.565
+1.518
3.24 mil%
1 ene 2008 año
0.017
-1.548
-98.91%
1 ene 2009 año
1.715
+1.698
10.0 mil%
1 ene 2010 año
-0.162
-1.877
-109.46%
1 ene 2011 año
2.211
+2.373
-1.46 mil%
1 ene 2012 año
-3.243
-5.454
-246.69%
1 ene 2013 año
0.337
+3.581
-110.4%
1 ene 2014 año
1.119
+0.782
231.86%
1 ene 2015 año
0.952
-0.168
-14.99%
1 ene 2016 año
0.919
-0.032
-3.4%
Ranking de los países por los datos estadísticos actuales


Comentarios: