29
/es/
es
AIzaSyAYiBZKx7MnpbEhh9jyipgxe19OcubqV5w
April 1, 2024
235113
Saudi Arabia
SAU
true
2
1
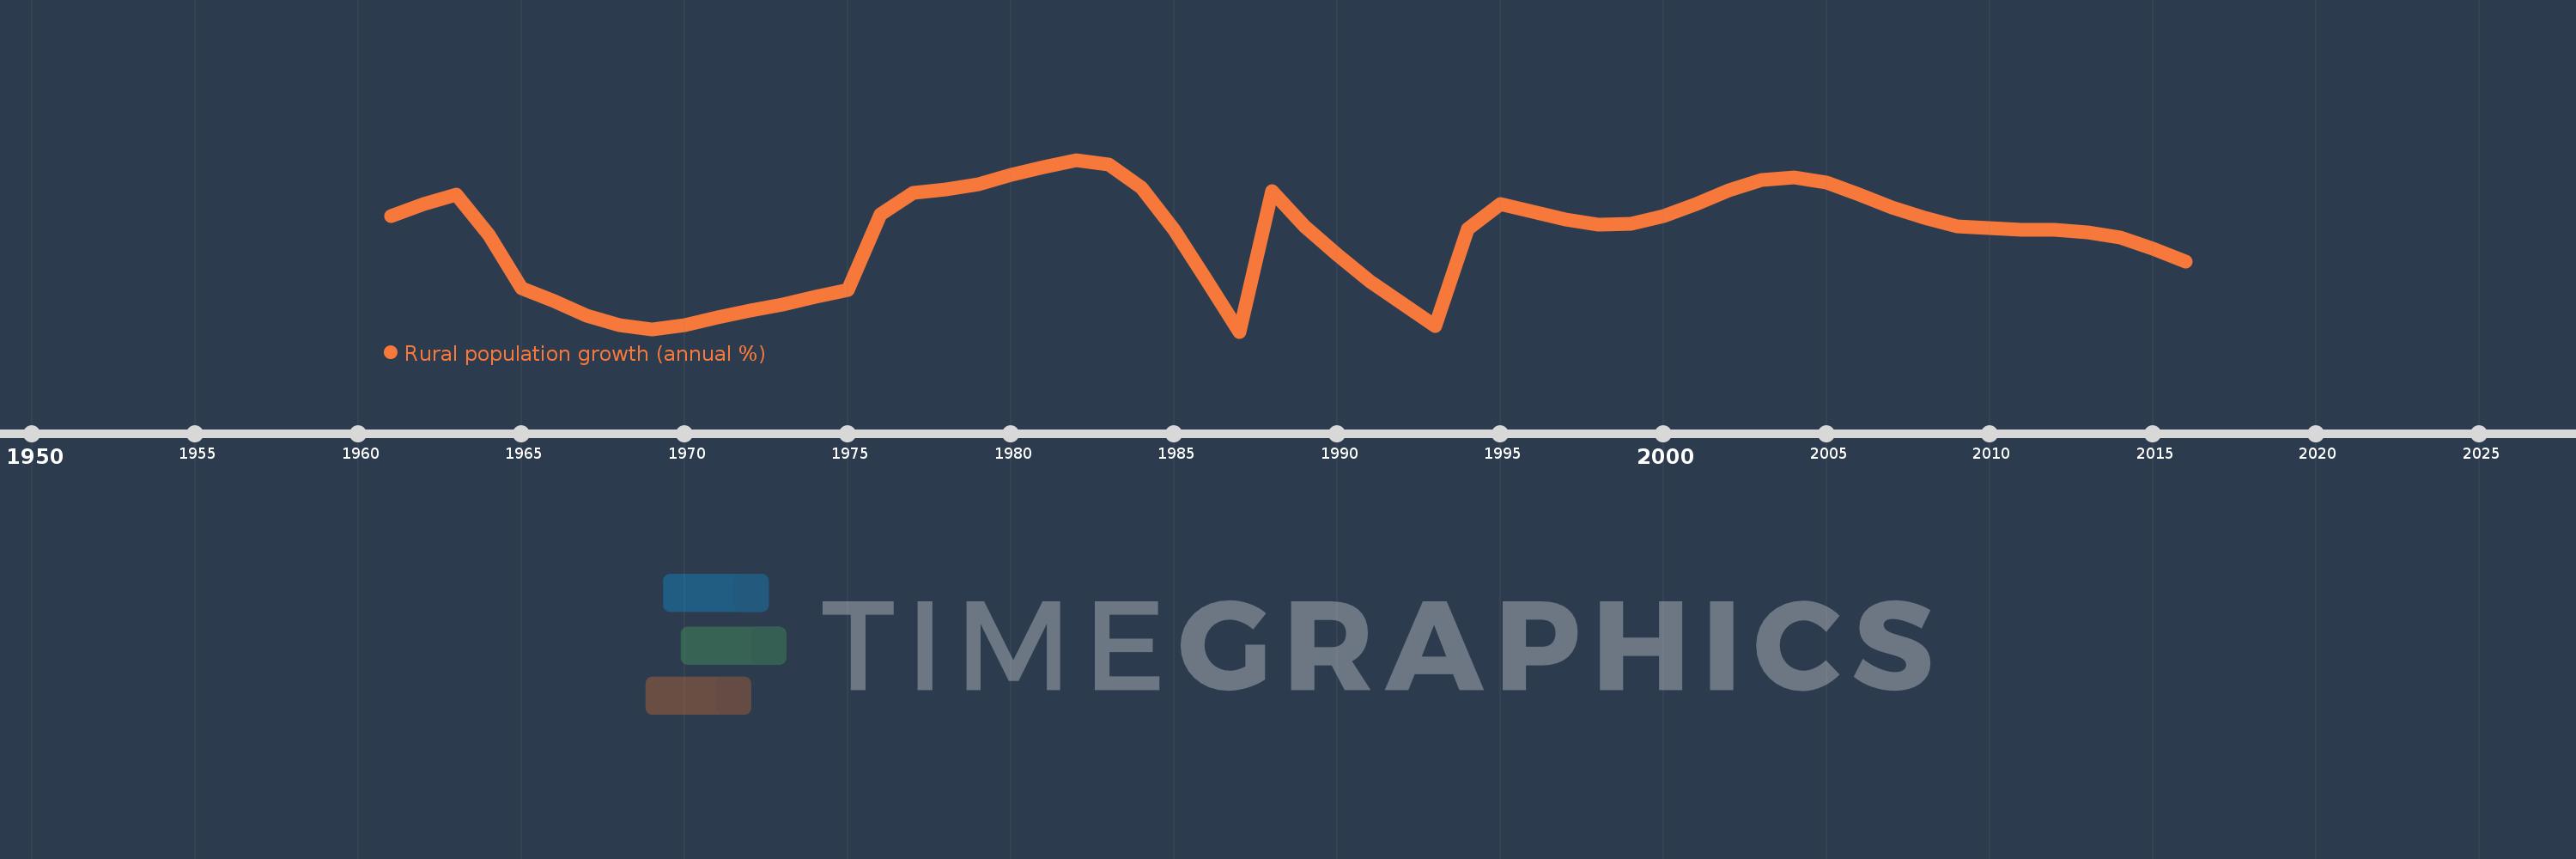
Rural population growth (annual %)
2016,2015,2014,2013,2012,2011,2010,2009,2008,2007,2006,2005,2004,2003,2002,2001,2000,1999,1998,1997,1996,1995,1994,1993,1992,1991,1990,1989,1988,1987,1986,1985,1984,1983,1982,1981,1980,1979,1978,1977,1976,1975,1974,1973,1972,1971,1970,1969,1968,1967,1966,1965,1964,1963,1962,1961
Estas estadísticas en otros países:
AfghanistanAlbaniaAlgeriaAmerican SamoaAndorraAngolaAntigua and BarbudaArab WorldArgentinaArmeniaArubaAustraliaAustriaAzerbaijanBahamas, TheBahrainBangladeshBarbadosBelarusBelgiumBelizeBeninBhutanBoliviaBosnia and HerzegovinaBotswanaBrazilBritish Virgin IslandsBrunei DarussalamBulgariaBurkina FasoBurundiCabo VerdeCambodiaCameroonCanadaCaribbean small statesCentral African RepublicCentral Europe and the BalticsChadChannel IslandsChileChinaColombiaComorosCongo, Dem. Rep.Congo, Rep.Costa RicaCote d'IvoireCroatiaCubaCuracaoCyprusCzech RepublicDenmarkDjiboutiDominicaDominican RepublicEarly-demographic dividendEast Asia & PacificEast Asia & Pacific (excluding high income)East Asia & Pacific (IDA & IBRD countries)EcuadorEgypt, Arab Rep.El SalvadorEquatorial GuineaEritreaEstoniaEthiopiaEuro areaEurope & Central AsiaEurope & Central Asia (excluding high income)Europe & Central Asia (IDA & IBRD countries)European UnionFaroe IslandsFijiFinlandFragile and conflict affected situationsFranceFrench PolynesiaGabonGambia, TheGeorgiaGermanyGhanaGreeceGreenlandGrenadaGuamGuatemalaGuineaGuinea-BissauGuyanaHaitiHeavily indebted poor countries (HIPC)High incomeHondurasHong Kong SAR, ChinaHungaryIBRD onlyIcelandIDA & IBRD totalIDA blendIDA onlyIDA totalIndiaIndonesiaIran, Islamic Rep.IraqIrelandIsle of ManIsraelItalyJamaicaJapanJordanKazakhstanKenyaKiribatiKorea, Dem. People’s Rep.Korea, Rep.KuwaitKyrgyz RepublicLao PDRLate-demographic dividendLatin America & Caribbean Latin America & Caribbean (excluding high income)Latin America & the Caribbean (IDA & IBRD countries)LatviaLeast developed countries: UN classificationLebanonLesothoLiberiaLibyaLiechtensteinLithuaniaLow & middle incomeLow incomeLower middle incomeLuxembourgMacao SAR, ChinaMacedonia, FYRMadagascarMalawiMalaysiaMaldivesMaliMaltaMarshall IslandsMauritaniaMauritiusMexicoMicronesia, Fed. Sts.Middle East & North AfricaMiddle East & North Africa (excluding high income)Middle East & North Africa (IDA & IBRD countries)Middle incomeMoldovaMongoliaMontenegroMoroccoMozambiqueMyanmarNamibiaNauruNepalNetherlandsNew CaledoniaNew ZealandNicaraguaNigerNigeriaNorth AmericaNorthern Mariana IslandsNorwayOECD membersOmanOther small statesPacific island small statesPakistanPalauPanamaPapua New GuineaParaguayPeruPhilippinesPolandPortugalPost-demographic dividendPre-demographic dividendPuerto RicoQatarRomaniaRussian FederationRwandaSamoaSan MarinoSao Tome and PrincipeSaudi ArabiaSenegalSerbiaSeychellesSierra LeoneSlovak RepublicSloveniaSmall statesSolomon IslandsSomaliaSouth AfricaSouth AsiaSouth Asia (IDA & IBRD)South SudanSpainSri LankaSt. Kitts and NevisSt. LuciaSt. Vincent and the GrenadinesSub-Saharan Africa Sub-Saharan Africa (excluding high income)Sub-Saharan Africa (IDA & IBRD countries)SudanSurinameSwazilandSwedenSwitzerlandSyrian Arab RepublicTajikistanTanzaniaThailandTimor-LesteTogoTongaTrinidad and TobagoTunisiaTurkeyTurkmenistanTurks and Caicos IslandsTuvaluUgandaUkraineUnited Arab EmiratesUnited KingdomUnited StatesUpper middle incomeUruguayUzbekistanVanuatuVenezuela, RBVietnamVirgin Islands (U.S.)West Bank and GazaWorldYemen, Rep.ZambiaZimbabwe línea de tiempo (timeline):
En esta escala de tiempo se presenta un gráfico de 1961 y 2016 de Saudi Arabia. Los datos de 1960 están ausentes. El número de observaciones reales por fecha: 56.
Fuente (nombre):
Indicadores del desarrollo mundial
Fuente (organización):
World Bank Staff estimates based on United Nations, World Urbanization Prospects.
Categorías:
Agriculture & Rural Development
Se ha actualizado:
23 abr 2017 año
Los indicadores de los cambios de valor en los últimos años
Mínimo:
0.099
1 ene 1987 año
Máximo:
2.043
1 ene 1982 año
A la fecha de observación
Valor
Cambio absoluto
El cambio con respecto al valor anterior
1 ene 1961 año
1.406
+1.406
0.0%
1 ene 1962 año
1.54
+0.134
9.56%
1 ene 1963 año
1.648
+0.108
7.02%
1 ene 1964 año
1.193
-0.455
-27.61%
1 ene 1965 año
0.592
-0.601
-50.41%
1 ene 1966 año
0.441
-0.151
-25.47%
1 ene 1967 año
0.282
-0.159
-35.97%
1 ene 1968 año
0.172
-0.11
-38.93%
1 ene 1969 año
0.125
-0.047
-27.3%
1 ene 1970 año
0.172
+0.047
37.17%
1 ene 1971 año
0.257
+0.085
49.22%
1 ene 1972 año
0.341
+0.084
32.86%
1 ene 1973 año
0.404
+0.063
18.55%
1 ene 1974 año
0.491
+0.087
21.55%
1 ene 1975 año
0.567
+0.076
15.43%
1 ene 1976 año
1.423
+0.856
150.89%
1 ene 1977 año
1.669
+0.246
17.27%
1 ene 1978 año
1.704
+0.035
2.11%
1 ene 1979 año
1.762
+0.058
3.39%
1 ene 1980 año
1.869
+0.108
6.11%
1 ene 1981 año
1.959
+0.089
4.78%
1 ene 1982 año
2.043
+0.084
4.3%
1 ene 1983 año
1.985
-0.058
-2.84%
1 ene 1984 año
1.726
-0.259
-13.03%
1 ene 1985 año
1.251
-0.475
-27.52%
1 ene 1986 año
0.682
-0.569
-45.46%
1 ene 1987 año
0.099
-0.584
-85.52%
1 ene 1988 año
1.692
+1.594
1.61 mil%
1 ene 1989 año
1.291
-0.402
-23.74%
1 ene 1990 año
0.966
-0.324
-25.13%
1 ene 1991 año
0.672
-0.294
-30.46%
1 ene 1992 año
0.412
-0.26
-38.75%
1 ene 1993 año
0.167
-0.244
-59.38%
1 ene 1994 año
1.265
+1.097
656.42%
1 ene 1995 año
1.543
+0.279
22.03%
1 ene 1996 año
1.457
-0.086
-5.6%
1 ene 1997 año
1.37
-0.086
-5.94%
1 ene 1998 año
1.314
-0.056
-4.1%
1 ene 1999 año
1.318
+0.004
0.28%
1 ene 2000 año
1.411
+0.093
7.03%
1 ene 2001 año
1.538
+0.128
9.06%
1 ene 2002 año
1.694
+0.156
10.15%
1 ene 2003 año
1.81
+0.115
6.8%
1 ene 2004 año
1.844
+0.034
1.87%
1 ene 2005 año
1.786
-0.057
-3.12%
1 ene 2006 año
1.651
-0.135
-7.58%
1 ene 2007 año
1.5
-0.15
-9.1%
1 ene 2008 año
1.383
-0.117
-7.81%
1 ene 2009 año
1.294
-0.089
-6.47%
1 ene 2010 año
1.267
-0.027
-2.06%
1 ene 2011 año
1.251
-0.016
-1.29%
1 ene 2012 año
1.252
+0.001
0.1%
1 ene 2013 año
1.223
-0.029
-2.29%
1 ene 2014 año
1.16
-0.064
-5.19%
1 ene 2015 año
1.039
-0.121
-10.39%
1 ene 2016 año
0.893
-0.147
-14.1%
Ranking de los países por los datos estadísticos actuales


Comentarios: