29
/es/
es
AIzaSyAYiBZKx7MnpbEhh9jyipgxe19OcubqV5w
April 1, 2024
119360
Denmark
DNK
true
2
1
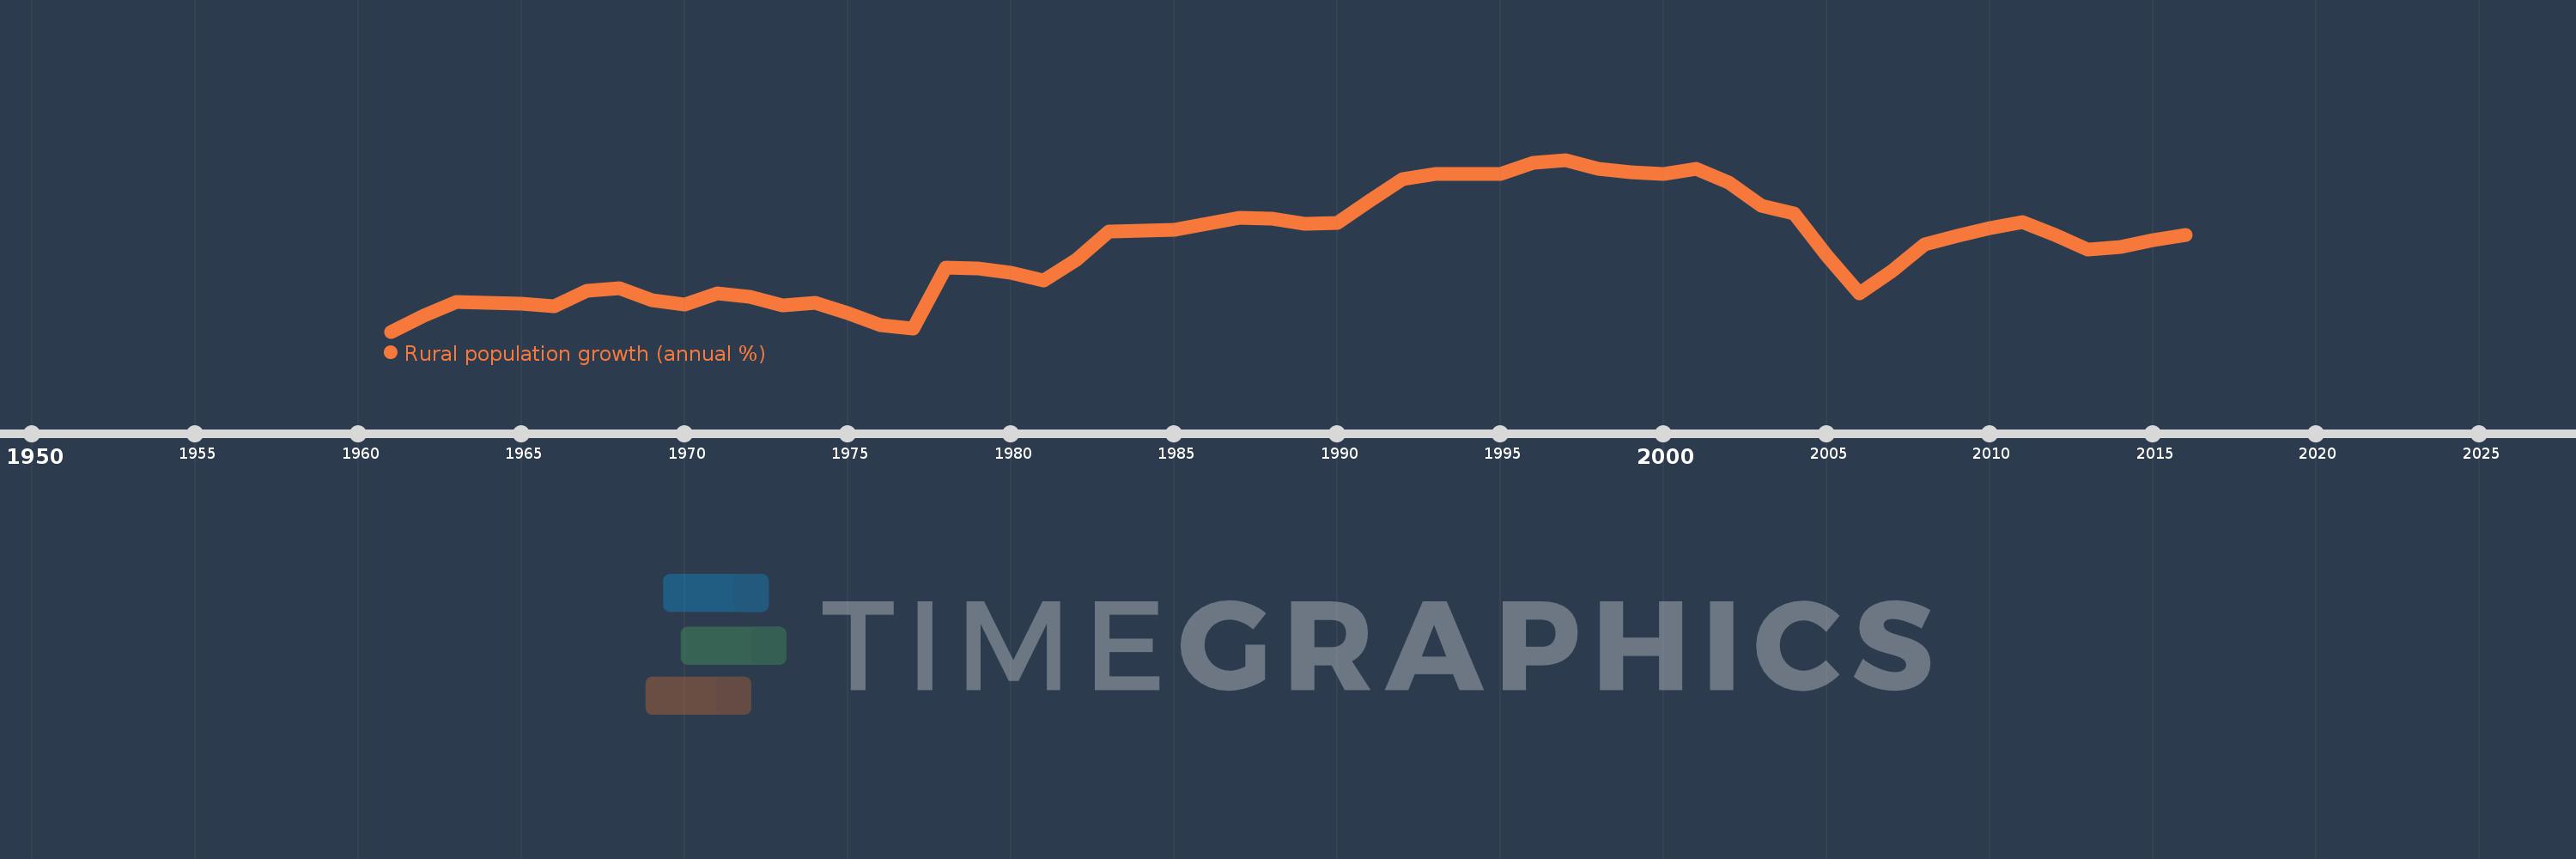
Rural population growth (annual %)
2016,2015,2014,2013,2012,2011,2010,2009,2008,2007,2006,2005,2004,2003,2002,2001,2000,1999,1998,1997,1996,1995,1994,1993,1992,1991,1990,1989,1988,1987,1986,1985,1984,1983,1982,1981,1980,1979,1978,1977,1976,1975,1974,1973,1972,1971,1970,1969,1968,1967,1966,1965,1964,1963,1962,1961
Estas estadísticas en otros países:
AfghanistanAlbaniaAlgeriaAmerican SamoaAndorraAngolaAntigua and BarbudaArab WorldArgentinaArmeniaArubaAustraliaAustriaAzerbaijanBahamas, TheBahrainBangladeshBarbadosBelarusBelgiumBelizeBeninBhutanBoliviaBosnia and HerzegovinaBotswanaBrazilBritish Virgin IslandsBrunei DarussalamBulgariaBurkina FasoBurundiCabo VerdeCambodiaCameroonCanadaCaribbean small statesCentral African RepublicCentral Europe and the BalticsChadChannel IslandsChileChinaColombiaComorosCongo, Dem. Rep.Congo, Rep.Costa RicaCote d'IvoireCroatiaCubaCuracaoCyprusCzech RepublicDenmarkDjiboutiDominicaDominican RepublicEarly-demographic dividendEast Asia & PacificEast Asia & Pacific (excluding high income)East Asia & Pacific (IDA & IBRD countries)EcuadorEgypt, Arab Rep.El SalvadorEquatorial GuineaEritreaEstoniaEthiopiaEuro areaEurope & Central AsiaEurope & Central Asia (excluding high income)Europe & Central Asia (IDA & IBRD countries)European UnionFaroe IslandsFijiFinlandFragile and conflict affected situationsFranceFrench PolynesiaGabonGambia, TheGeorgiaGermanyGhanaGreeceGreenlandGrenadaGuamGuatemalaGuineaGuinea-BissauGuyanaHaitiHeavily indebted poor countries (HIPC)High incomeHondurasHong Kong SAR, ChinaHungaryIBRD onlyIcelandIDA & IBRD totalIDA blendIDA onlyIDA totalIndiaIndonesiaIran, Islamic Rep.IraqIrelandIsle of ManIsraelItalyJamaicaJapanJordanKazakhstanKenyaKiribatiKorea, Dem. People’s Rep.Korea, Rep.KuwaitKyrgyz RepublicLao PDRLate-demographic dividendLatin America & Caribbean Latin America & Caribbean (excluding high income)Latin America & the Caribbean (IDA & IBRD countries)LatviaLeast developed countries: UN classificationLebanonLesothoLiberiaLibyaLiechtensteinLithuaniaLow & middle incomeLow incomeLower middle incomeLuxembourgMacao SAR, ChinaMacedonia, FYRMadagascarMalawiMalaysiaMaldivesMaliMaltaMarshall IslandsMauritaniaMauritiusMexicoMicronesia, Fed. Sts.Middle East & North AfricaMiddle East & North Africa (excluding high income)Middle East & North Africa (IDA & IBRD countries)Middle incomeMoldovaMongoliaMontenegroMoroccoMozambiqueMyanmarNamibiaNauruNepalNetherlandsNew CaledoniaNew ZealandNicaraguaNigerNigeriaNorth AmericaNorthern Mariana IslandsNorwayOECD membersOmanOther small statesPacific island small statesPakistanPalauPanamaPapua New GuineaParaguayPeruPhilippinesPolandPortugalPost-demographic dividendPre-demographic dividendPuerto RicoQatarRomaniaRussian FederationRwandaSamoaSan MarinoSao Tome and PrincipeSaudi ArabiaSenegalSerbiaSeychellesSierra LeoneSlovak RepublicSloveniaSmall statesSolomon IslandsSomaliaSouth AfricaSouth AsiaSouth Asia (IDA & IBRD)South SudanSpainSri LankaSt. Kitts and NevisSt. LuciaSt. Vincent and the GrenadinesSub-Saharan Africa Sub-Saharan Africa (excluding high income)Sub-Saharan Africa (IDA & IBRD countries)SudanSurinameSwazilandSwedenSwitzerlandSyrian Arab RepublicTajikistanTanzaniaThailandTimor-LesteTogoTongaTrinidad and TobagoTunisiaTurkeyTurkmenistanTurks and Caicos IslandsTuvaluUgandaUkraineUnited Arab EmiratesUnited KingdomUnited StatesUpper middle incomeUruguayUzbekistanVanuatuVenezuela, RBVietnamVirgin Islands (U.S.)West Bank and GazaWorldYemen, Rep.ZambiaZimbabwe línea de tiempo (timeline):
En esta escala de tiempo se presenta un gráfico de 1961 y 2016 de Denmark. Los datos de 1960 están ausentes. El número de observaciones reales por fecha: 56.
Fuente (nombre):
Indicadores del desarrollo mundial
Fuente (organización):
World Bank Staff estimates based on United Nations, World Urbanization Prospects.
Categorías:
Agriculture & Rural Development
Se ha actualizado:
23 abr 2017 año
Los indicadores de los cambios de valor en los últimos años
Mínimo:
-2.374
1 ene 1961 año
Máximo:
0.386
1 ene 1997 año
A la fecha de observación
Valor
Cambio absoluto
El cambio con respecto al valor anterior
1 ene 1961 año
-2.374
-2.374
0.0%
1 ene 1962 año
-2.115
+0.259
-10.9%
1 ene 1963 año
-1.9
+0.216
-10.2%
1 ene 1964 año
-1.914
-0.015
0.78%
1 ene 1965 año
-1.927
-0.013
0.66%
1 ene 1966 año
-1.967
-0.04
2.06%
1 ene 1967 año
-1.716
+0.251
-12.74%
1 ene 1968 año
-1.672
+0.044
-2.56%
1 ene 1969 año
-1.872
-0.199
11.92%
1 ene 1970 año
-1.938
-0.066
3.52%
1 ene 1971 año
-1.758
+0.179
-9.25%
1 ene 1972 año
-1.814
-0.055
3.15%
1 ene 1973 año
-1.949
-0.135
7.47%
1 ene 1974 año
-1.918
+0.031
-1.59%
1 ene 1975 año
-2.079
-0.16
8.36%
1 ene 1976 año
-2.272
-0.193
9.3%
1 ene 1977 año
-2.324
-0.052
2.31%
1 ene 1978 año
-1.346
+0.978
-42.1%
1 ene 1979 año
-1.357
-0.011
0.81%
1 ene 1980 año
-1.426
-0.069
5.09%
1 ene 1981 año
-1.554
-0.128
8.97%
1 ene 1982 año
-1.215
+0.339
-21.81%
1 ene 1983 año
-0.76
+0.455
-37.47%
1 ene 1984 año
-0.753
+0.006
-0.84%
1 ene 1985 año
-0.742
+0.012
-1.55%
1 ene 1986 año
-0.647
+0.094
-12.74%
1 ene 1987 año
-0.552
+0.095
-14.64%
1 ene 1988 año
-0.564
-0.012
2.11%
1 ene 1989 año
-0.64
-0.076
13.53%
1 ene 1990 año
-0.634
+0.006
-1.01%
1 ene 1991 año
-0.272
+0.362
-57.08%
1 ene 1992 año
0.075
+0.347
-127.44%
1 ene 1993 año
0.152
+0.077
103.55%
1 ene 1994 año
0.154
+0.002
1.53%
1 ene 1995 año
0.158
+0.004
2.66%
1 ene 1996 año
0.341
+0.183
115.51%
1 ene 1997 año
0.386
+0.045
13.06%
1 ene 1998 año
0.235
-0.151
-39.01%
1 ene 1999 año
0.183
-0.053
-22.47%
1 ene 2000 año
0.157
-0.026
-14.13%
1 ene 2001 año
0.24
+0.084
53.36%
1 ene 2002 año
0.022
-0.218
-90.8%
1 ene 2003 año
-0.356
-0.378
-1.71 mil%
1 ene 2004 año
-0.477
-0.12
33.82%
1 ene 2005 año
-1.159
-0.682
143.12%
1 ene 2006 año
-1.754
-0.596
51.4%
1 ene 2007 año
-1.397
+0.357
-20.36%
1 ene 2008 año
-0.969
+0.428
-30.62%
1 ene 2009 año
-0.838
+0.131
-13.56%
1 ene 2010 año
-0.709
+0.129
-15.44%
1 ene 2011 año
-0.618
+0.091
-12.8%
1 ene 2012 año
-0.823
-0.205
33.16%
1 ene 2013 año
-1.052
-0.23
27.92%
1 ene 2014 año
-1.009
+0.044
-4.16%
1 ene 2015 año
-0.907
+0.102
-10.06%
1 ene 2016 año
-0.827
+0.08
-8.78%
Ranking de los países por los datos estadísticos actuales


Comentarios: