29
/es/
es
AIzaSyAYiBZKx7MnpbEhh9jyipgxe19OcubqV5w
April 1, 2024
146303
Guinea
GIN
true
2
1
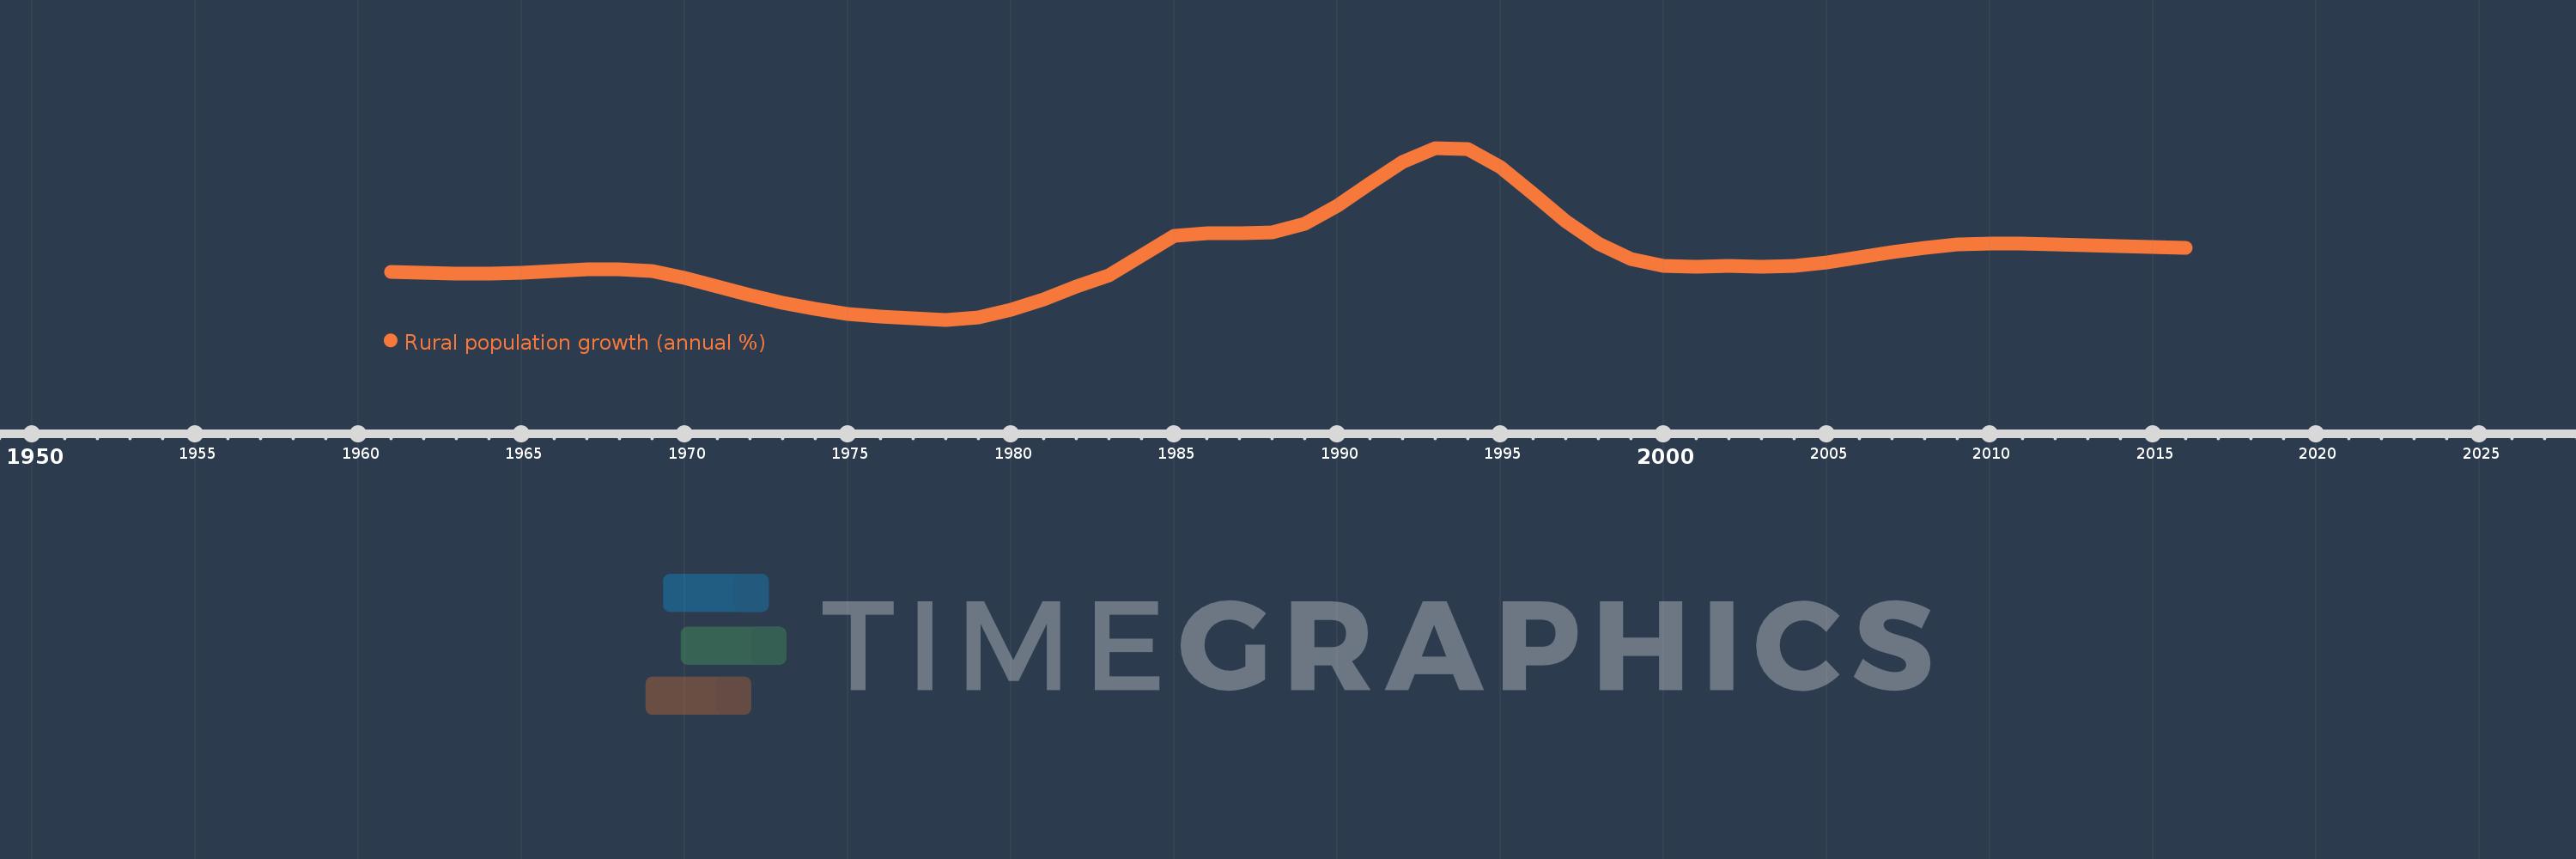
Rural population growth (annual %)
2016,2015,2014,2013,2012,2011,2010,2009,2008,2007,2006,2005,2004,2003,2002,2001,2000,1999,1998,1997,1996,1995,1994,1993,1992,1991,1990,1989,1988,1987,1986,1985,1984,1983,1982,1981,1980,1979,1978,1977,1976,1975,1974,1973,1972,1971,1970,1969,1968,1967,1966,1965,1964,1963,1962,1961
Estas estadísticas en otros países:
AfghanistanAlbaniaAlgeriaAmerican SamoaAndorraAngolaAntigua and BarbudaArab WorldArgentinaArmeniaArubaAustraliaAustriaAzerbaijanBahamas, TheBahrainBangladeshBarbadosBelarusBelgiumBelizeBeninBhutanBoliviaBosnia and HerzegovinaBotswanaBrazilBritish Virgin IslandsBrunei DarussalamBulgariaBurkina FasoBurundiCabo VerdeCambodiaCameroonCanadaCaribbean small statesCentral African RepublicCentral Europe and the BalticsChadChannel IslandsChileChinaColombiaComorosCongo, Dem. Rep.Congo, Rep.Costa RicaCote d'IvoireCroatiaCubaCuracaoCyprusCzech RepublicDenmarkDjiboutiDominicaDominican RepublicEarly-demographic dividendEast Asia & PacificEast Asia & Pacific (excluding high income)East Asia & Pacific (IDA & IBRD countries)EcuadorEgypt, Arab Rep.El SalvadorEquatorial GuineaEritreaEstoniaEthiopiaEuro areaEurope & Central AsiaEurope & Central Asia (excluding high income)Europe & Central Asia (IDA & IBRD countries)European UnionFaroe IslandsFijiFinlandFragile and conflict affected situationsFranceFrench PolynesiaGabonGambia, TheGeorgiaGermanyGhanaGreeceGreenlandGrenadaGuamGuatemalaGuineaGuinea-BissauGuyanaHaitiHeavily indebted poor countries (HIPC)High incomeHondurasHong Kong SAR, ChinaHungaryIBRD onlyIcelandIDA & IBRD totalIDA blendIDA onlyIDA totalIndiaIndonesiaIran, Islamic Rep.IraqIrelandIsle of ManIsraelItalyJamaicaJapanJordanKazakhstanKenyaKiribatiKorea, Dem. People’s Rep.Korea, Rep.KuwaitKyrgyz RepublicLao PDRLate-demographic dividendLatin America & Caribbean Latin America & Caribbean (excluding high income)Latin America & the Caribbean (IDA & IBRD countries)LatviaLeast developed countries: UN classificationLebanonLesothoLiberiaLibyaLiechtensteinLithuaniaLow & middle incomeLow incomeLower middle incomeLuxembourgMacao SAR, ChinaMacedonia, FYRMadagascarMalawiMalaysiaMaldivesMaliMaltaMarshall IslandsMauritaniaMauritiusMexicoMicronesia, Fed. Sts.Middle East & North AfricaMiddle East & North Africa (excluding high income)Middle East & North Africa (IDA & IBRD countries)Middle incomeMoldovaMongoliaMontenegroMoroccoMozambiqueMyanmarNamibiaNauruNepalNetherlandsNew CaledoniaNew ZealandNicaraguaNigerNigeriaNorth AmericaNorthern Mariana IslandsNorwayOECD membersOmanOther small statesPacific island small statesPakistanPalauPanamaPapua New GuineaParaguayPeruPhilippinesPolandPortugalPost-demographic dividendPre-demographic dividendPuerto RicoQatarRomaniaRussian FederationRwandaSamoaSan MarinoSao Tome and PrincipeSaudi ArabiaSenegalSerbiaSeychellesSierra LeoneSlovak RepublicSloveniaSmall statesSolomon IslandsSomaliaSouth AfricaSouth AsiaSouth Asia (IDA & IBRD)South SudanSpainSri LankaSt. Kitts and NevisSt. LuciaSt. Vincent and the GrenadinesSub-Saharan Africa Sub-Saharan Africa (excluding high income)Sub-Saharan Africa (IDA & IBRD countries)SudanSurinameSwazilandSwedenSwitzerlandSyrian Arab RepublicTajikistanTanzaniaThailandTimor-LesteTogoTongaTrinidad and TobagoTunisiaTurkeyTurkmenistanTurks and Caicos IslandsTuvaluUgandaUkraineUnited Arab EmiratesUnited KingdomUnited StatesUpper middle incomeUruguayUzbekistanVanuatuVenezuela, RBVietnamVirgin Islands (U.S.)West Bank and GazaWorldYemen, Rep.ZambiaZimbabwe línea de tiempo (timeline):
En esta escala de tiempo se presenta un gráfico de 1961 y 2016 de Guinea. Los datos de 1960 están ausentes. El número de observaciones reales por fecha: 56.
Fuente (nombre):
Indicadores del desarrollo mundial
Fuente (organización):
World Bank Staff estimates based on United Nations, World Urbanization Prospects.
Categorías:
Agriculture & Rural Development
Se ha actualizado:
23 abr 2017 año
Los indicadores de los cambios de valor en los últimos años
Mínimo:
-0.621
1 ene 1978 año
Máximo:
5.456
1 ene 1993 año
A la fecha de observación
Valor
Cambio absoluto
El cambio con respecto al valor anterior
1 ene 1961 año
1.071
+1.071
0.0%
1 ene 1962 año
1.044
-0.028
-2.58%
1 ene 1963 año
1.019
-0.025
-2.39%
1 ene 1964 año
1.018
-0.001
-0.11%
1 ene 1965 año
1.05
+0.032
3.18%
1 ene 1966 año
1.094
+0.044
4.19%
1 ene 1967 año
1.155
+0.061
5.56%
1 ene 1968 año
1.177
+0.022
1.92%
1 ene 1969 año
1.089
-0.088
-7.46%
1 ene 1970 año
0.866
-0.223
-20.51%
1 ene 1971 año
0.555
-0.311
-35.9%
1 ene 1972 año
0.237
-0.318
-57.29%
1 ene 1973 año
-0.029
-0.266
-112.14%
1 ene 1974 año
-0.247
-0.218
758.97%
1 ene 1975 año
-0.404
-0.157
63.5%
1 ene 1976 año
-0.494
-0.09
22.18%
1 ene 1977 año
-0.579
-0.085
17.3%
1 ene 1978 año
-0.621
-0.042
7.26%
1 ene 1979 año
-0.533
+0.088
-14.12%
1 ene 1980 año
-0.278
+0.255
-47.86%
1 ene 1981 año
0.092
+0.37
-133.18%
1 ene 1982 año
0.544
+0.451
489.43%
1 ene 1983 año
0.959
+0.415
76.29%
1 ene 1984 año
1.638
+0.679
70.86%
1 ene 1985 año
2.349
+0.711
43.42%
1 ene 1986 año
2.451
+0.102
4.34%
1 ene 1987 año
2.434
-0.017
-0.67%
1 ene 1988 año
2.475
+0.041
1.69%
1 ene 1989 año
2.785
+0.31
12.51%
1 ene 1990 año
3.422
+0.637
22.88%
1 ene 1991 año
4.187
+0.764
22.34%
1 ene 1992 año
4.974
+0.787
18.8%
1 ene 1993 año
5.456
+0.482
9.7%
1 ene 1994 año
5.409
-0.048
-0.88%
1 ene 1995 año
4.774
-0.635
-11.74%
1 ene 1996 año
3.828
-0.945
-19.81%
1 ene 1997 año
2.856
-0.973
-25.41%
1 ene 1998 año
2.087
-0.769
-26.92%
1 ene 1999 año
1.535
-0.551
-26.42%
1 ene 2000 año
1.292
-0.243
-15.85%
1 ene 2001 año
1.268
-0.024
-1.89%
1 ene 2002 año
1.273
+0.005
0.41%
1 ene 2003 año
1.248
-0.025
-1.96%
1 ene 2004 año
1.293
+0.045
3.63%
1 ene 2005 año
1.411
+0.118
9.14%
1 ene 2006 año
1.573
+0.161
11.42%
1 ene 2007 año
1.763
+0.19
12.1%
1 ene 2008 año
1.935
+0.172
9.78%
1 ene 2009 año
2.053
+0.118
6.09%
1 ene 2010 año
2.088
+0.035
1.71%
1 ene 2011 año
2.073
-0.016
-0.75%
1 ene 2012 año
2.043
-0.029
-1.42%
1 ene 2013 año
2.024
-0.02
-0.96%
1 ene 2014 año
1.994
-0.03
-1.46%
1 ene 2015 año
1.957
-0.037
-1.86%
1 ene 2016 año
1.915
-0.043
-2.18%
Ranking de los países por los datos estadísticos actuales


Comentarios: