29
/es/
es
AIzaSyAYiBZKx7MnpbEhh9jyipgxe19OcubqV5w
April 1, 2024
153050
Hungary
HUN
true
2
1
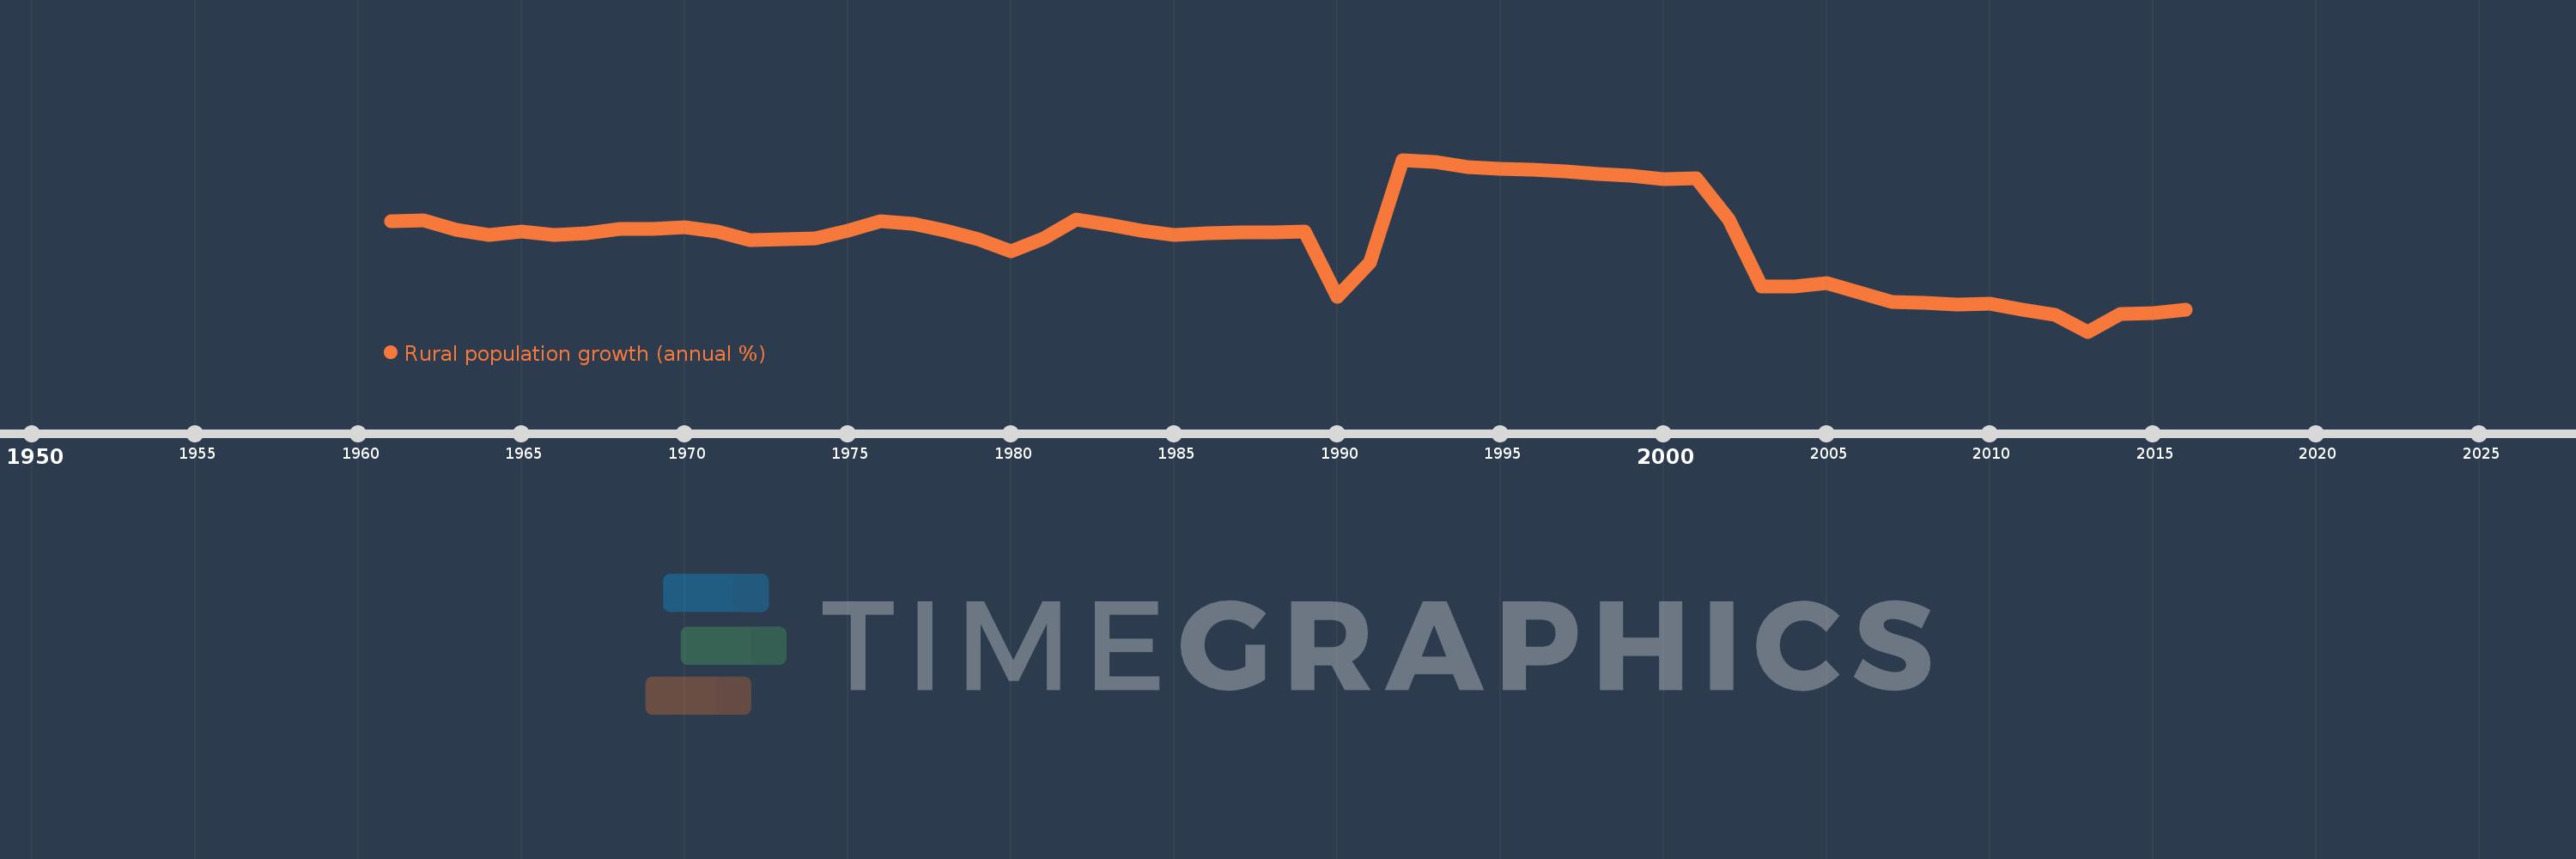
Rural population growth (annual %)
2016,2015,2014,2013,2012,2011,2010,2009,2008,2007,2006,2005,2004,2003,2002,2001,2000,1999,1998,1997,1996,1995,1994,1993,1992,1991,1990,1989,1988,1987,1986,1985,1984,1983,1982,1981,1980,1979,1978,1977,1976,1975,1974,1973,1972,1971,1970,1969,1968,1967,1966,1965,1964,1963,1962,1961
Estas estadísticas en otros países:
AfghanistanAlbaniaAlgeriaAmerican SamoaAndorraAngolaAntigua and BarbudaArab WorldArgentinaArmeniaArubaAustraliaAustriaAzerbaijanBahamas, TheBahrainBangladeshBarbadosBelarusBelgiumBelizeBeninBhutanBoliviaBosnia and HerzegovinaBotswanaBrazilBritish Virgin IslandsBrunei DarussalamBulgariaBurkina FasoBurundiCabo VerdeCambodiaCameroonCanadaCaribbean small statesCentral African RepublicCentral Europe and the BalticsChadChannel IslandsChileChinaColombiaComorosCongo, Dem. Rep.Congo, Rep.Costa RicaCote d'IvoireCroatiaCubaCuracaoCyprusCzech RepublicDenmarkDjiboutiDominicaDominican RepublicEarly-demographic dividendEast Asia & PacificEast Asia & Pacific (excluding high income)East Asia & Pacific (IDA & IBRD countries)EcuadorEgypt, Arab Rep.El SalvadorEquatorial GuineaEritreaEstoniaEthiopiaEuro areaEurope & Central AsiaEurope & Central Asia (excluding high income)Europe & Central Asia (IDA & IBRD countries)European UnionFaroe IslandsFijiFinlandFragile and conflict affected situationsFranceFrench PolynesiaGabonGambia, TheGeorgiaGermanyGhanaGreeceGreenlandGrenadaGuamGuatemalaGuineaGuinea-BissauGuyanaHaitiHeavily indebted poor countries (HIPC)High incomeHondurasHong Kong SAR, ChinaHungaryIBRD onlyIcelandIDA & IBRD totalIDA blendIDA onlyIDA totalIndiaIndonesiaIran, Islamic Rep.IraqIrelandIsle of ManIsraelItalyJamaicaJapanJordanKazakhstanKenyaKiribatiKorea, Dem. People’s Rep.Korea, Rep.KuwaitKyrgyz RepublicLao PDRLate-demographic dividendLatin America & Caribbean Latin America & Caribbean (excluding high income)Latin America & the Caribbean (IDA & IBRD countries)LatviaLeast developed countries: UN classificationLebanonLesothoLiberiaLibyaLiechtensteinLithuaniaLow & middle incomeLow incomeLower middle incomeLuxembourgMacao SAR, ChinaMacedonia, FYRMadagascarMalawiMalaysiaMaldivesMaliMaltaMarshall IslandsMauritaniaMauritiusMexicoMicronesia, Fed. Sts.Middle East & North AfricaMiddle East & North Africa (excluding high income)Middle East & North Africa (IDA & IBRD countries)Middle incomeMoldovaMongoliaMontenegroMoroccoMozambiqueMyanmarNamibiaNauruNepalNetherlandsNew CaledoniaNew ZealandNicaraguaNigerNigeriaNorth AmericaNorthern Mariana IslandsNorwayOECD membersOmanOther small statesPacific island small statesPakistanPalauPanamaPapua New GuineaParaguayPeruPhilippinesPolandPortugalPost-demographic dividendPre-demographic dividendPuerto RicoQatarRomaniaRussian FederationRwandaSamoaSan MarinoSao Tome and PrincipeSaudi ArabiaSenegalSerbiaSeychellesSierra LeoneSlovak RepublicSloveniaSmall statesSolomon IslandsSomaliaSouth AfricaSouth AsiaSouth Asia (IDA & IBRD)South SudanSpainSri LankaSt. Kitts and NevisSt. LuciaSt. Vincent and the GrenadinesSub-Saharan Africa Sub-Saharan Africa (excluding high income)Sub-Saharan Africa (IDA & IBRD countries)SudanSurinameSwazilandSwedenSwitzerlandSyrian Arab RepublicTajikistanTanzaniaThailandTimor-LesteTogoTongaTrinidad and TobagoTunisiaTurkeyTurkmenistanTurks and Caicos IslandsTuvaluUgandaUkraineUnited Arab EmiratesUnited KingdomUnited StatesUpper middle incomeUruguayUzbekistanVanuatuVenezuela, RBVietnamVirgin Islands (U.S.)West Bank and GazaWorldYemen, Rep.ZambiaZimbabwe línea de tiempo (timeline):
En esta escala de tiempo se presenta un gráfico de 1961 y 2016 de Hungary. Los datos de 1960 están ausentes. El número de observaciones reales por fecha: 56.
Fuente (nombre):
Indicadores del desarrollo mundial
Fuente (organización):
World Bank Staff estimates based on United Nations, World Urbanization Prospects.
Categorías:
Agriculture & Rural Development
Se ha actualizado:
23 abr 2017 año
Los indicadores de los cambios de valor en los últimos años
Mínimo:
-2.108
1 ene 2013 año
Máximo:
0.36
1 ene 1992 año
A la fecha de observación
Valor
Cambio absoluto
El cambio con respecto al valor anterior
1 ene 1961 año
-0.528
-0.528
0.0%
1 ene 1962 año
-0.513
+0.015
-2.77%
1 ene 1963 año
-0.651
-0.138
26.84%
1 ene 1964 año
-0.723
-0.072
11.07%
1 ene 1965 año
-0.675
+0.048
-6.64%
1 ene 1966 año
-0.716
-0.041
6.08%
1 ene 1967 año
-0.701
+0.015
-2.09%
1 ene 1968 año
-0.639
+0.062
-8.87%
1 ene 1969 año
-0.636
+0.003
-0.47%
1 ene 1970 año
-0.607
+0.029
-4.55%
1 ene 1971 año
-0.67
-0.063
10.44%
1 ene 1972 año
-0.79
-0.12
17.9%
1 ene 1973 año
-0.787
+0.003
-0.35%
1 ene 1974 año
-0.767
+0.02
-2.55%
1 ene 1975 año
-0.653
+0.115
-14.94%
1 ene 1976 año
-0.52
+0.132
-20.26%
1 ene 1977 año
-0.565
-0.045
8.64%
1 ene 1978 año
-0.655
-0.09
15.93%
1 ene 1979 año
-0.782
-0.127
19.36%
1 ene 1980 año
-0.957
-0.174
22.27%
1 ene 1981 año
-0.764
+0.193
-20.17%
1 ene 1982 año
-0.5
+0.264
-34.53%
1 ene 1983 año
-0.568
-0.068
13.66%
1 ene 1984 año
-0.662
-0.094
16.52%
1 ene 1985 año
-0.715
-0.052
7.93%
1 ene 1986 año
-0.696
+0.018
-2.58%
1 ene 1987 año
-0.685
+0.012
-1.65%
1 ene 1988 año
-0.685
+0.0
-0.02%
1 ene 1989 año
-0.673
+0.012
-1.73%
1 ene 1990 año
-1.608
-0.936
139.06%
1 ene 1991 año
-1.115
+0.493
-30.67%
1 ene 1992 año
0.36
+1.475
-132.25%
1 ene 1993 año
0.328
-0.032
-8.88%
1 ene 1994 año
0.251
-0.076
-23.26%
1 ene 1995 año
0.227
-0.024
-9.62%
1 ene 1996 año
0.224
-0.004
-1.61%
1 ene 1997 año
0.19
-0.034
-15.14%
1 ene 1998 año
0.162
-0.028
-14.83%
1 ene 1999 año
0.129
-0.033
-20.14%
1 ene 2000 año
0.077
-0.052
-40.19%
1 ene 2001 año
0.099
+0.022
28.76%
1 ene 2002 año
-0.498
-0.597
-601.0%
1 ene 2003 año
-1.455
-0.957
192.22%
1 ene 2004 año
-1.462
-0.007
0.47%
1 ene 2005 año
-1.408
+0.054
-3.69%
1 ene 2006 año
-1.551
-0.143
10.17%
1 ene 2007 año
-1.68
-0.129
8.33%
1 ene 2008 año
-1.691
-0.011
0.63%
1 ene 2009 año
-1.725
-0.035
2.06%
1 ene 2010 año
-1.711
+0.015
-0.85%
1 ene 2011 año
-1.797
-0.086
5.03%
1 ene 2012 año
-1.866
-0.069
3.86%
1 ene 2013 año
-2.108
-0.242
12.97%
1 ene 2014 año
-1.859
+0.249
-11.81%
1 ene 2015 año
-1.848
+0.011
-0.61%
1 ene 2016 año
-1.793
+0.054
-2.94%
Ranking de los países por los datos estadísticos actuales


Comentarios: