29
/es/
es
AIzaSyAYiBZKx7MnpbEhh9jyipgxe19OcubqV5w
April 1, 2024
145067
Guatemala
GTM
true
2
1
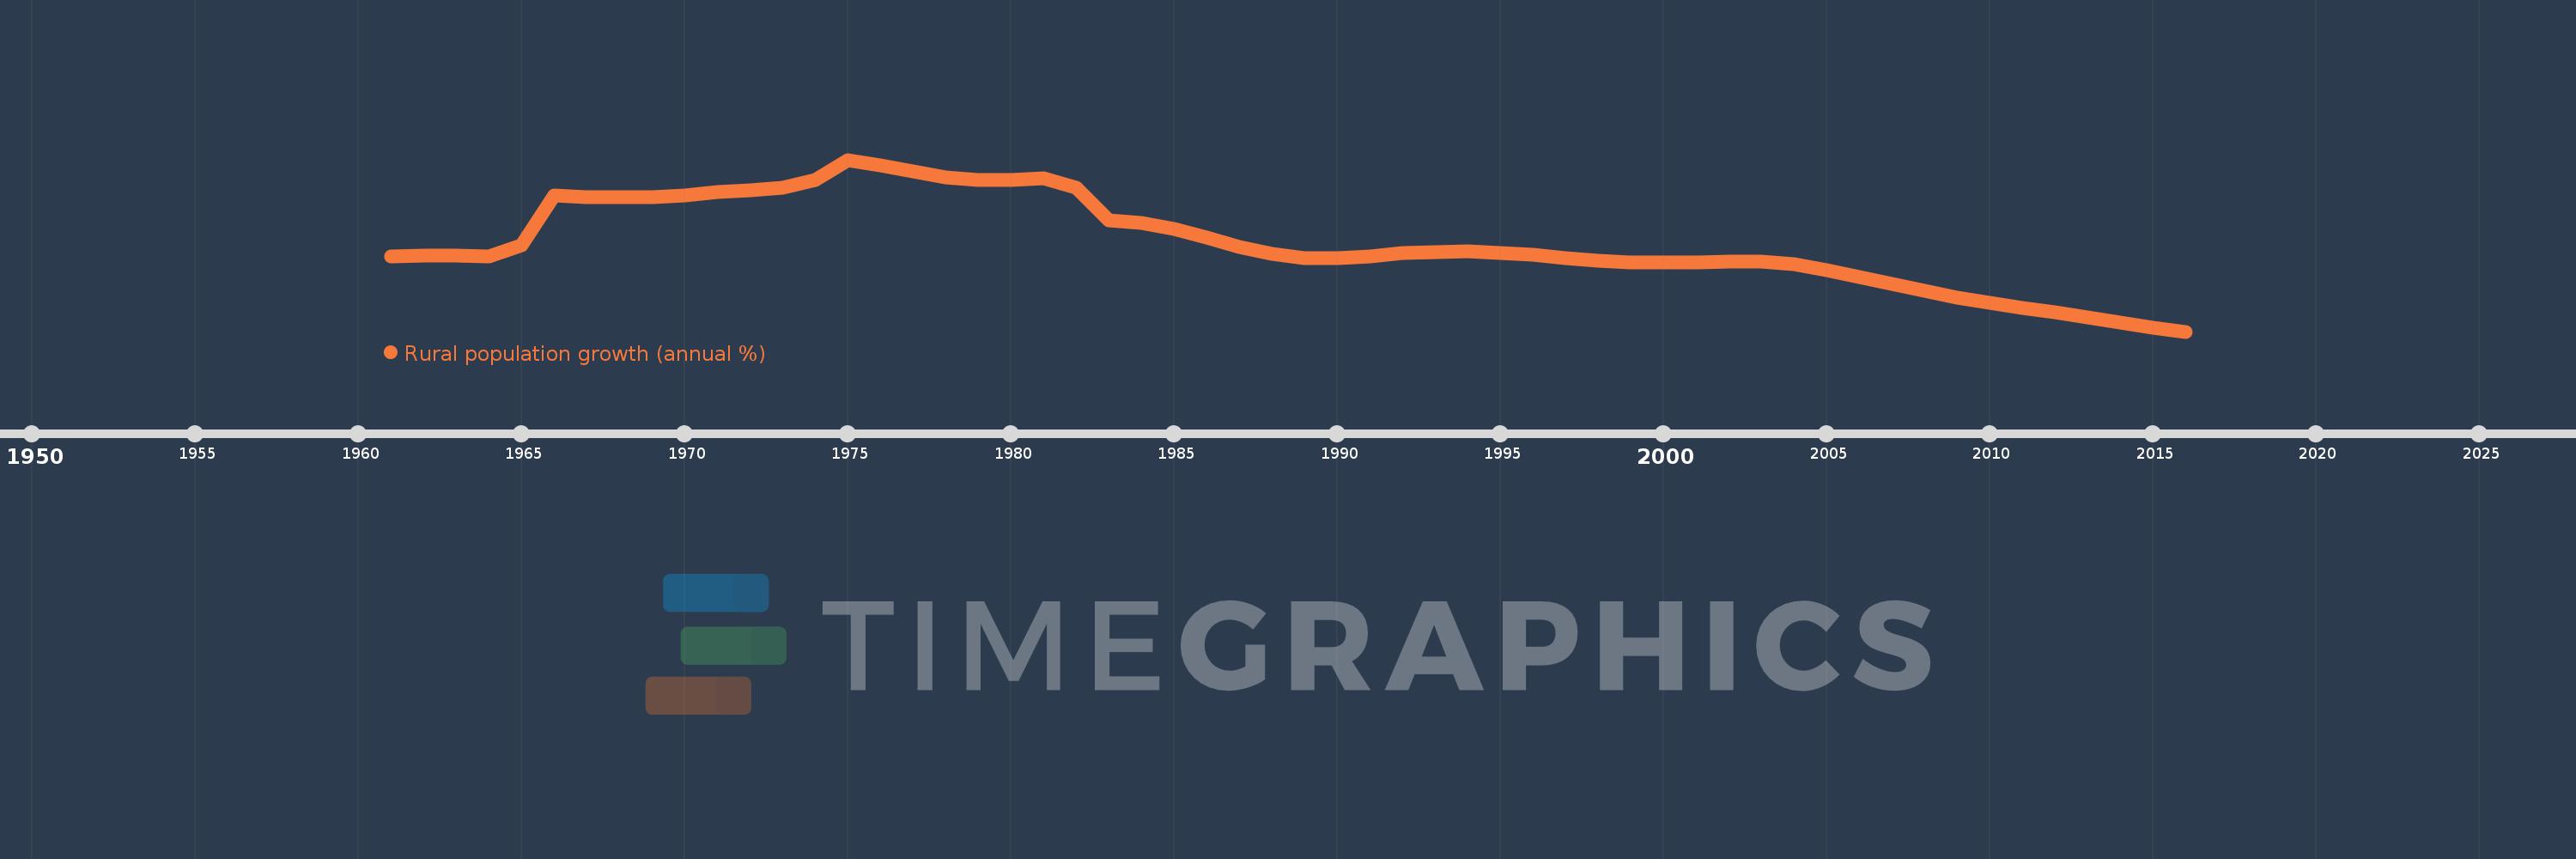
Rural population growth (annual %)
2016,2015,2014,2013,2012,2011,2010,2009,2008,2007,2006,2005,2004,2003,2002,2001,2000,1999,1998,1997,1996,1995,1994,1993,1992,1991,1990,1989,1988,1987,1986,1985,1984,1983,1982,1981,1980,1979,1978,1977,1976,1975,1974,1973,1972,1971,1970,1969,1968,1967,1966,1965,1964,1963,1962,1961
Estas estadísticas en otros países:
AfghanistanAlbaniaAlgeriaAmerican SamoaAndorraAngolaAntigua and BarbudaArab WorldArgentinaArmeniaArubaAustraliaAustriaAzerbaijanBahamas, TheBahrainBangladeshBarbadosBelarusBelgiumBelizeBeninBhutanBoliviaBosnia and HerzegovinaBotswanaBrazilBritish Virgin IslandsBrunei DarussalamBulgariaBurkina FasoBurundiCabo VerdeCambodiaCameroonCanadaCaribbean small statesCentral African RepublicCentral Europe and the BalticsChadChannel IslandsChileChinaColombiaComorosCongo, Dem. Rep.Congo, Rep.Costa RicaCote d'IvoireCroatiaCubaCuracaoCyprusCzech RepublicDenmarkDjiboutiDominicaDominican RepublicEarly-demographic dividendEast Asia & PacificEast Asia & Pacific (excluding high income)East Asia & Pacific (IDA & IBRD countries)EcuadorEgypt, Arab Rep.El SalvadorEquatorial GuineaEritreaEstoniaEthiopiaEuro areaEurope & Central AsiaEurope & Central Asia (excluding high income)Europe & Central Asia (IDA & IBRD countries)European UnionFaroe IslandsFijiFinlandFragile and conflict affected situationsFranceFrench PolynesiaGabonGambia, TheGeorgiaGermanyGhanaGreeceGreenlandGrenadaGuamGuatemalaGuineaGuinea-BissauGuyanaHaitiHeavily indebted poor countries (HIPC)High incomeHondurasHong Kong SAR, ChinaHungaryIBRD onlyIcelandIDA & IBRD totalIDA blendIDA onlyIDA totalIndiaIndonesiaIran, Islamic Rep.IraqIrelandIsle of ManIsraelItalyJamaicaJapanJordanKazakhstanKenyaKiribatiKorea, Dem. People’s Rep.Korea, Rep.KuwaitKyrgyz RepublicLao PDRLate-demographic dividendLatin America & Caribbean Latin America & Caribbean (excluding high income)Latin America & the Caribbean (IDA & IBRD countries)LatviaLeast developed countries: UN classificationLebanonLesothoLiberiaLibyaLiechtensteinLithuaniaLow & middle incomeLow incomeLower middle incomeLuxembourgMacao SAR, ChinaMacedonia, FYRMadagascarMalawiMalaysiaMaldivesMaliMaltaMarshall IslandsMauritaniaMauritiusMexicoMicronesia, Fed. Sts.Middle East & North AfricaMiddle East & North Africa (excluding high income)Middle East & North Africa (IDA & IBRD countries)Middle incomeMoldovaMongoliaMontenegroMoroccoMozambiqueMyanmarNamibiaNauruNepalNetherlandsNew CaledoniaNew ZealandNicaraguaNigerNigeriaNorth AmericaNorthern Mariana IslandsNorwayOECD membersOmanOther small statesPacific island small statesPakistanPalauPanamaPapua New GuineaParaguayPeruPhilippinesPolandPortugalPost-demographic dividendPre-demographic dividendPuerto RicoQatarRomaniaRussian FederationRwandaSamoaSan MarinoSao Tome and PrincipeSaudi ArabiaSenegalSerbiaSeychellesSierra LeoneSlovak RepublicSloveniaSmall statesSolomon IslandsSomaliaSouth AfricaSouth AsiaSouth Asia (IDA & IBRD)South SudanSpainSri LankaSt. Kitts and NevisSt. LuciaSt. Vincent and the GrenadinesSub-Saharan Africa Sub-Saharan Africa (excluding high income)Sub-Saharan Africa (IDA & IBRD countries)SudanSurinameSwazilandSwedenSwitzerlandSyrian Arab RepublicTajikistanTanzaniaThailandTimor-LesteTogoTongaTrinidad and TobagoTunisiaTurkeyTurkmenistanTurks and Caicos IslandsTuvaluUgandaUkraineUnited Arab EmiratesUnited KingdomUnited StatesUpper middle incomeUruguayUzbekistanVanuatuVenezuela, RBVietnamVirgin Islands (U.S.)West Bank and GazaWorldYemen, Rep.ZambiaZimbabwe línea de tiempo (timeline):
En esta escala de tiempo se presenta un gráfico de 1961 y 2016 de Guatemala. Los datos de 1960 están ausentes. El número de observaciones reales por fecha: 56.
Fuente (nombre):
Indicadores del desarrollo mundial
Fuente (organización):
World Bank Staff estimates based on United Nations, World Urbanization Prospects.
Categorías:
Agriculture & Rural Development
Se ha actualizado:
23 abr 2017 año
Los indicadores de los cambios de valor en los últimos años
Mínimo:
1.087
1 ene 2016 año
Máximo:
2.578
1 ene 1975 año
A la fecha de observación
Valor
Cambio absoluto
El cambio con respecto al valor anterior
1 ene 1961 año
1.741
+1.741
0.0%
1 ene 1962 año
1.746
+0.005
0.3%
1 ene 1963 año
1.744
-0.002
-0.1%
1 ene 1964 año
1.74
-0.004
-0.23%
1 ene 1965 año
1.836
+0.095
5.48%
1 ene 1966 año
2.267
+0.431
23.47%
1 ene 1967 año
2.257
-0.009
-0.42%
1 ene 1968 año
2.252
-0.005
-0.22%
1 ene 1969 año
2.257
+0.004
0.2%
1 ene 1970 año
2.272
+0.015
0.67%
1 ene 1971 año
2.295
+0.023
1.03%
1 ene 1972 año
2.316
+0.022
0.94%
1 ene 1973 año
2.332
+0.016
0.69%
1 ene 1974 año
2.4
+0.068
2.91%
1 ene 1975 año
2.578
+0.177
7.39%
1 ene 1976 año
2.53
-0.048
-1.85%
1 ene 1977 año
2.475
-0.055
-2.19%
1 ene 1978 año
2.428
-0.046
-1.87%
1 ene 1979 año
2.401
-0.028
-1.14%
1 ene 1980 año
2.402
+0.002
0.08%
1 ene 1981 año
2.415
+0.012
0.52%
1 ene 1982 año
2.332
-0.083
-3.44%
1 ene 1983 año
2.05
-0.281
-12.07%
1 ene 1984 año
2.03
-0.02
-0.98%
1 ene 1985 año
1.976
-0.054
-2.68%
1 ene 1986 año
1.906
-0.07
-3.55%
1 ene 1987 año
1.825
-0.08
-4.21%
1 ene 1988 año
1.765
-0.06
-3.3%
1 ene 1989 año
1.726
-0.039
-2.23%
1 ene 1990 año
1.726
+0.001
0.04%
1 ene 1991 año
1.742
+0.015
0.9%
1 ene 1992 año
1.768
+0.026
1.49%
1 ene 1993 año
1.779
+0.012
0.66%
1 ene 1994 año
1.787
+0.007
0.4%
1 ene 1995 año
1.772
-0.014
-0.79%
1 ene 1996 año
1.752
-0.021
-1.18%
1 ene 1997 año
1.723
-0.029
-1.65%
1 ene 1998 año
1.702
-0.021
-1.22%
1 ene 1999 año
1.686
-0.016
-0.94%
1 ene 2000 año
1.685
-0.001
-0.05%
1 ene 2001 año
1.688
+0.003
0.18%
1 ene 2002 año
1.694
+0.006
0.35%
1 ene 2003 año
1.691
-0.003
-0.17%
1 ene 2004 año
1.669
-0.022
-1.32%
1 ene 2005 año
1.621
-0.047
-2.85%
1 ene 2006 año
1.562
-0.059
-3.61%
1 ene 2007 año
1.498
-0.064
-4.1%
1 ene 2008 año
1.438
-0.06
-4.01%
1 ene 2009 año
1.385
-0.054
-3.74%
1 ene 2010 año
1.336
-0.049
-3.53%
1 ene 2011 año
1.293
-0.042
-3.16%
1 ene 2012 año
1.253
-0.04
-3.13%
1 ene 2013 año
1.207
-0.046
-3.68%
1 ene 2014 año
1.168
-0.039
-3.24%
1 ene 2015 año
1.124
-0.044
-3.77%
1 ene 2016 año
1.087
-0.037
-3.32%
Ranking de los países por los datos estadísticos actuales


Comentarios: