29
/es/
es
AIzaSyAYiBZKx7MnpbEhh9jyipgxe19OcubqV5w
April 1, 2024
213943
Northern Mariana Islands
MNP
true
2
1
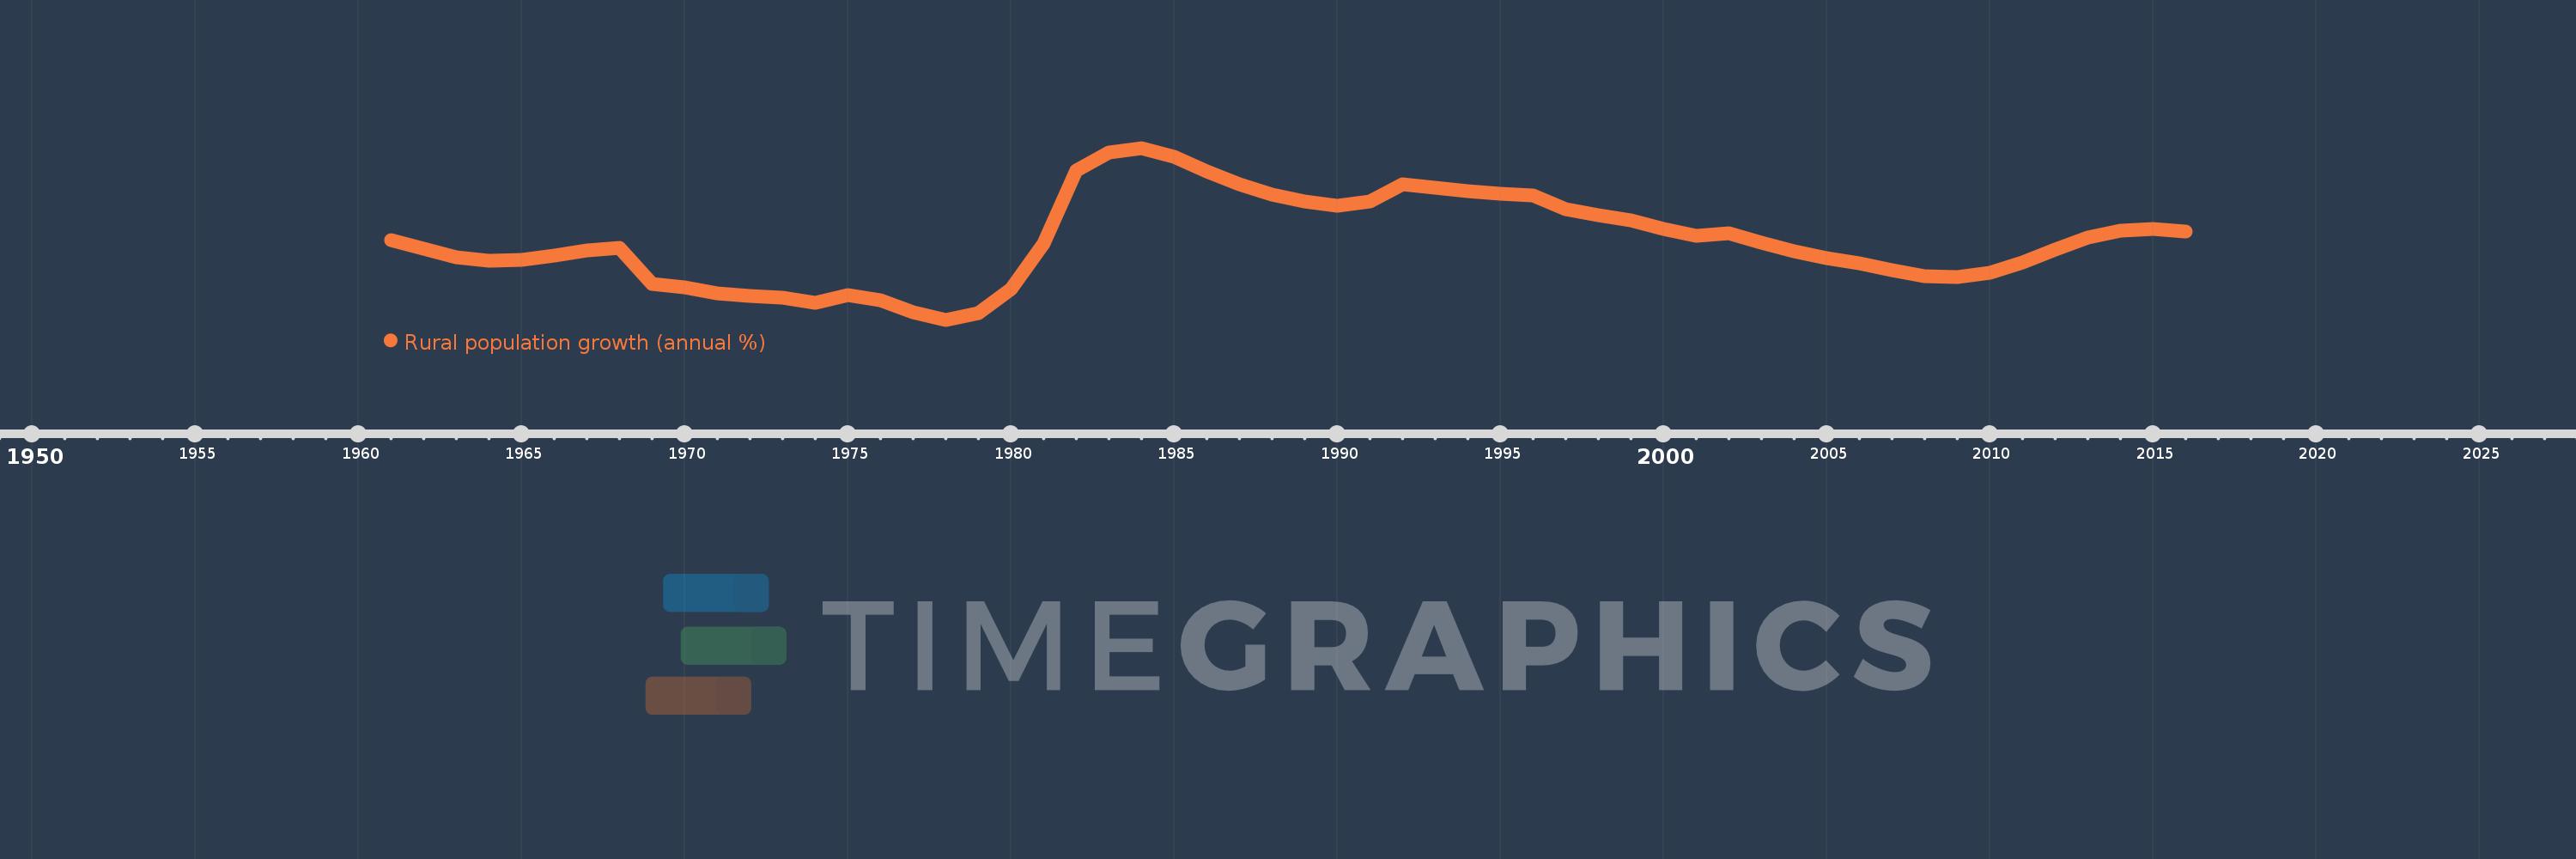
Rural population growth (annual %)
2016,2015,2014,2013,2012,2011,2010,2009,2008,2007,2006,2005,2004,2003,2002,2001,2000,1999,1998,1997,1996,1995,1994,1993,1992,1991,1990,1989,1988,1987,1986,1985,1984,1983,1982,1981,1980,1979,1978,1977,1976,1975,1974,1973,1972,1971,1970,1969,1968,1967,1966,1965,1964,1963,1962,1961
Estas estadísticas en otros países:
AfghanistanAlbaniaAlgeriaAmerican SamoaAndorraAngolaAntigua and BarbudaArab WorldArgentinaArmeniaArubaAustraliaAustriaAzerbaijanBahamas, TheBahrainBangladeshBarbadosBelarusBelgiumBelizeBeninBhutanBoliviaBosnia and HerzegovinaBotswanaBrazilBritish Virgin IslandsBrunei DarussalamBulgariaBurkina FasoBurundiCabo VerdeCambodiaCameroonCanadaCaribbean small statesCentral African RepublicCentral Europe and the BalticsChadChannel IslandsChileChinaColombiaComorosCongo, Dem. Rep.Congo, Rep.Costa RicaCote d'IvoireCroatiaCubaCuracaoCyprusCzech RepublicDenmarkDjiboutiDominicaDominican RepublicEarly-demographic dividendEast Asia & PacificEast Asia & Pacific (excluding high income)East Asia & Pacific (IDA & IBRD countries)EcuadorEgypt, Arab Rep.El SalvadorEquatorial GuineaEritreaEstoniaEthiopiaEuro areaEurope & Central AsiaEurope & Central Asia (excluding high income)Europe & Central Asia (IDA & IBRD countries)European UnionFaroe IslandsFijiFinlandFragile and conflict affected situationsFranceFrench PolynesiaGabonGambia, TheGeorgiaGermanyGhanaGreeceGreenlandGrenadaGuamGuatemalaGuineaGuinea-BissauGuyanaHaitiHeavily indebted poor countries (HIPC)High incomeHondurasHong Kong SAR, ChinaHungaryIBRD onlyIcelandIDA & IBRD totalIDA blendIDA onlyIDA totalIndiaIndonesiaIran, Islamic Rep.IraqIrelandIsle of ManIsraelItalyJamaicaJapanJordanKazakhstanKenyaKiribatiKorea, Dem. People’s Rep.Korea, Rep.KuwaitKyrgyz RepublicLao PDRLate-demographic dividendLatin America & Caribbean Latin America & Caribbean (excluding high income)Latin America & the Caribbean (IDA & IBRD countries)LatviaLeast developed countries: UN classificationLebanonLesothoLiberiaLibyaLiechtensteinLithuaniaLow & middle incomeLow incomeLower middle incomeLuxembourgMacao SAR, ChinaMacedonia, FYRMadagascarMalawiMalaysiaMaldivesMaliMaltaMarshall IslandsMauritaniaMauritiusMexicoMicronesia, Fed. Sts.Middle East & North AfricaMiddle East & North Africa (excluding high income)Middle East & North Africa (IDA & IBRD countries)Middle incomeMoldovaMongoliaMontenegroMoroccoMozambiqueMyanmarNamibiaNauruNepalNetherlandsNew CaledoniaNew ZealandNicaraguaNigerNigeriaNorth AmericaNorthern Mariana IslandsNorwayOECD membersOmanOther small statesPacific island small statesPakistanPalauPanamaPapua New GuineaParaguayPeruPhilippinesPolandPortugalPost-demographic dividendPre-demographic dividendPuerto RicoQatarRomaniaRussian FederationRwandaSamoaSan MarinoSao Tome and PrincipeSaudi ArabiaSenegalSerbiaSeychellesSierra LeoneSlovak RepublicSloveniaSmall statesSolomon IslandsSomaliaSouth AfricaSouth AsiaSouth Asia (IDA & IBRD)South SudanSpainSri LankaSt. Kitts and NevisSt. LuciaSt. Vincent and the GrenadinesSub-Saharan Africa Sub-Saharan Africa (excluding high income)Sub-Saharan Africa (IDA & IBRD countries)SudanSurinameSwazilandSwedenSwitzerlandSyrian Arab RepublicTajikistanTanzaniaThailandTimor-LesteTogoTongaTrinidad and TobagoTunisiaTurkeyTurkmenistanTurks and Caicos IslandsTuvaluUgandaUkraineUnited Arab EmiratesUnited KingdomUnited StatesUpper middle incomeUruguayUzbekistanVanuatuVenezuela, RBVietnamVirgin Islands (U.S.)West Bank and GazaWorldYemen, Rep.ZambiaZimbabwe línea de tiempo (timeline):
En esta escala de tiempo se presenta un gráfico de 1961 y 2016 de Northern Mariana Islands. Los datos de 1960 están ausentes. El número de observaciones reales por fecha: 56.
Fuente (nombre):
Indicadores del desarrollo mundial
Fuente (organización):
World Bank Staff estimates based on United Nations, World Urbanization Prospects.
Categorías:
Agriculture & Rural Development
Se ha actualizado:
23 abr 2017 año
Los indicadores de los cambios de valor en los últimos años
Mínimo:
-8.044
1 ene 1978 año
Máximo:
10.219
1 ene 1984 año
A la fecha de observación
Valor
Cambio absoluto
El cambio con respecto al valor anterior
1 ene 1961 año
0.428
+0.428
0.0%
1 ene 1962 año
-0.51
-0.939
-219.1%
1 ene 1963 año
-1.36
-0.849
166.48%
1 ene 1964 año
-1.779
-0.419
30.82%
1 ene 1965 año
-1.661
+0.118
-6.64%
1 ene 1966 año
-1.231
+0.429
-25.86%
1 ene 1967 año
-0.698
+0.533
-43.32%
1 ene 1968 año
-0.373
+0.325
-46.59%
1 ene 1969 año
-4.264
-3.891
1.04 mil%
1 ene 1970 año
-4.645
-0.382
8.96%
1 ene 1971 año
-5.2
-0.555
11.94%
1 ene 1972 año
-5.512
-0.312
6.0%
1 ene 1973 año
-5.721
-0.208
3.78%
1 ene 1974 año
-6.279
-0.558
9.75%
1 ene 1975 año
-5.418
+0.86
-13.7%
1 ene 1976 año
-5.931
-0.513
9.47%
1 ene 1977 año
-7.208
-1.277
21.53%
1 ene 1978 año
-8.044
-0.835
11.59%
1 ene 1979 año
-7.384
+0.66
-8.21%
1 ene 1980 año
-4.813
+2.57
-34.81%
1 ene 1981 año
0.089
+4.902
-101.85%
1 ene 1982 año
7.809
+7.721
8.69 mil%
1 ene 1983 año
9.77
+1.96
25.1%
1 ene 1984 año
10.219
+0.45
4.6%
1 ene 1985 año
9.24
-0.979
-9.58%
1 ene 1986 año
7.723
-1.517
-16.42%
1 ene 1987 año
6.347
-1.376
-17.82%
1 ene 1988 año
5.289
-1.058
-16.68%
1 ene 1989 año
4.542
-0.747
-14.13%
1 ene 1990 año
4.067
-0.475
-10.46%
1 ene 1991 año
4.508
+0.441
10.84%
1 ene 1992 año
6.392
+1.884
41.79%
1 ene 1993 año
5.988
-0.404
-6.32%
1 ene 1994 año
5.631
-0.357
-5.96%
1 ene 1995 año
5.383
-0.248
-4.4%
1 ene 1996 año
5.158
-0.225
-4.18%
1 ene 1997 año
3.693
-1.465
-28.4%
1 ene 1998 año
3.112
-0.582
-15.75%
1 ene 1999 año
2.534
-0.578
-18.57%
1 ene 2000 año
1.609
-0.924
-36.48%
1 ene 2001 año
0.921
-0.689
-42.78%
1 ene 2002 año
1.19
+0.27
29.27%
1 ene 2003 año
0.161
-1.03
-86.51%
1 ene 2004 año
-0.732
-0.893
-555.84%
1 ene 2005 año
-1.495
-0.763
104.26%
1 ene 2006 año
-2.08
-0.585
39.1%
1 ene 2007 año
-2.764
-0.684
32.89%
1 ene 2008 año
-3.375
-0.611
22.13%
1 ene 2009 año
-3.543
-0.168
4.98%
1 ene 2010 año
-3.049
+0.494
-13.95%
1 ene 2011 año
-1.974
+1.075
-35.26%
1 ene 2012 año
-0.602
+1.372
-69.52%
1 ene 2013 año
0.672
+1.274
-211.73%
1 ene 2014 año
1.47
+0.798
118.7%
1 ene 2015 año
1.62
+0.15
10.19%
1 ene 2016 año
1.291
-0.329
-20.32%
Ranking de los países por los datos estadísticos actuales


Comentarios: