29
/es/
es
AIzaSyAYiBZKx7MnpbEhh9jyipgxe19OcubqV5w
April 1, 2024
25298
Caribbean small states
CSS
false
2
1
Rural population growth (annual %)
2016,2015,2014,2013,2012,2011,2010,2009,2008,2007,2006,2005,2004,2003,2002,2001,2000,1999,1998,1997,1996,1995,1994,1993,1992,1991,1990,1989,1988,1987,1986,1985,1984,1983,1982,1981,1980,1979,1978,1977,1976,1975,1974,1973,1972,1971,1970,1969,1968,1967,1966,1965,1964,1963,1962
Estas estadísticas en otros países:
AfghanistanAlbaniaAlgeriaAmerican SamoaAndorraAngolaAntigua and BarbudaArab WorldArgentinaArmeniaArubaAustraliaAustriaAzerbaijanBahamas, TheBahrainBangladeshBarbadosBelarusBelgiumBelizeBeninBhutanBoliviaBosnia and HerzegovinaBotswanaBrazilBritish Virgin IslandsBrunei DarussalamBulgariaBurkina FasoBurundiCabo VerdeCambodiaCameroonCanadaCaribbean small statesCentral African RepublicCentral Europe and the BalticsChadChannel IslandsChileChinaColombiaComorosCongo, Dem. Rep.Congo, Rep.Costa RicaCote d'IvoireCroatiaCubaCuracaoCyprusCzech RepublicDenmarkDjiboutiDominicaDominican RepublicEarly-demographic dividendEast Asia & PacificEast Asia & Pacific (excluding high income)East Asia & Pacific (IDA & IBRD countries)EcuadorEgypt, Arab Rep.El SalvadorEquatorial GuineaEritreaEstoniaEthiopiaEuro areaEurope & Central AsiaEurope & Central Asia (excluding high income)Europe & Central Asia (IDA & IBRD countries)European UnionFaroe IslandsFijiFinlandFragile and conflict affected situationsFranceFrench PolynesiaGabonGambia, TheGeorgiaGermanyGhanaGreeceGreenlandGrenadaGuamGuatemalaGuineaGuinea-BissauGuyanaHaitiHeavily indebted poor countries (HIPC)High incomeHondurasHong Kong SAR, ChinaHungaryIBRD onlyIcelandIDA & IBRD totalIDA blendIDA onlyIDA totalIndiaIndonesiaIran, Islamic Rep.IraqIrelandIsle of ManIsraelItalyJamaicaJapanJordanKazakhstanKenyaKiribatiKorea, Dem. People’s Rep.Korea, Rep.KuwaitKyrgyz RepublicLao PDRLate-demographic dividendLatin America & Caribbean Latin America & Caribbean (excluding high income)Latin America & the Caribbean (IDA & IBRD countries)LatviaLeast developed countries: UN classificationLebanonLesothoLiberiaLibyaLiechtensteinLithuaniaLow & middle incomeLow incomeLower middle incomeLuxembourgMacao SAR, ChinaMacedonia, FYRMadagascarMalawiMalaysiaMaldivesMaliMaltaMarshall IslandsMauritaniaMauritiusMexicoMicronesia, Fed. Sts.Middle East & North AfricaMiddle East & North Africa (excluding high income)Middle East & North Africa (IDA & IBRD countries)Middle incomeMoldovaMongoliaMontenegroMoroccoMozambiqueMyanmarNamibiaNauruNepalNetherlandsNew CaledoniaNew ZealandNicaraguaNigerNigeriaNorth AmericaNorthern Mariana IslandsNorwayOECD membersOmanOther small statesPacific island small statesPakistanPalauPanamaPapua New GuineaParaguayPeruPhilippinesPolandPortugalPost-demographic dividendPre-demographic dividendPuerto RicoQatarRomaniaRussian FederationRwandaSamoaSan MarinoSao Tome and PrincipeSaudi ArabiaSenegalSerbiaSeychellesSierra LeoneSlovak RepublicSloveniaSmall statesSolomon IslandsSomaliaSouth AfricaSouth AsiaSouth Asia (IDA & IBRD)South SudanSpainSri LankaSt. Kitts and NevisSt. LuciaSt. Vincent and the GrenadinesSub-Saharan Africa Sub-Saharan Africa (excluding high income)Sub-Saharan Africa (IDA & IBRD countries)SudanSurinameSwazilandSwedenSwitzerlandSyrian Arab RepublicTajikistanTanzaniaThailandTimor-LesteTogoTongaTrinidad and TobagoTunisiaTurkeyTurkmenistanTurks and Caicos IslandsTuvaluUgandaUkraineUnited Arab EmiratesUnited KingdomUnited StatesUpper middle incomeUruguayUzbekistanVanuatuVenezuela, RBVietnamVirgin Islands (U.S.)West Bank and GazaWorldYemen, Rep.ZambiaZimbabwe línea de tiempo (timeline):
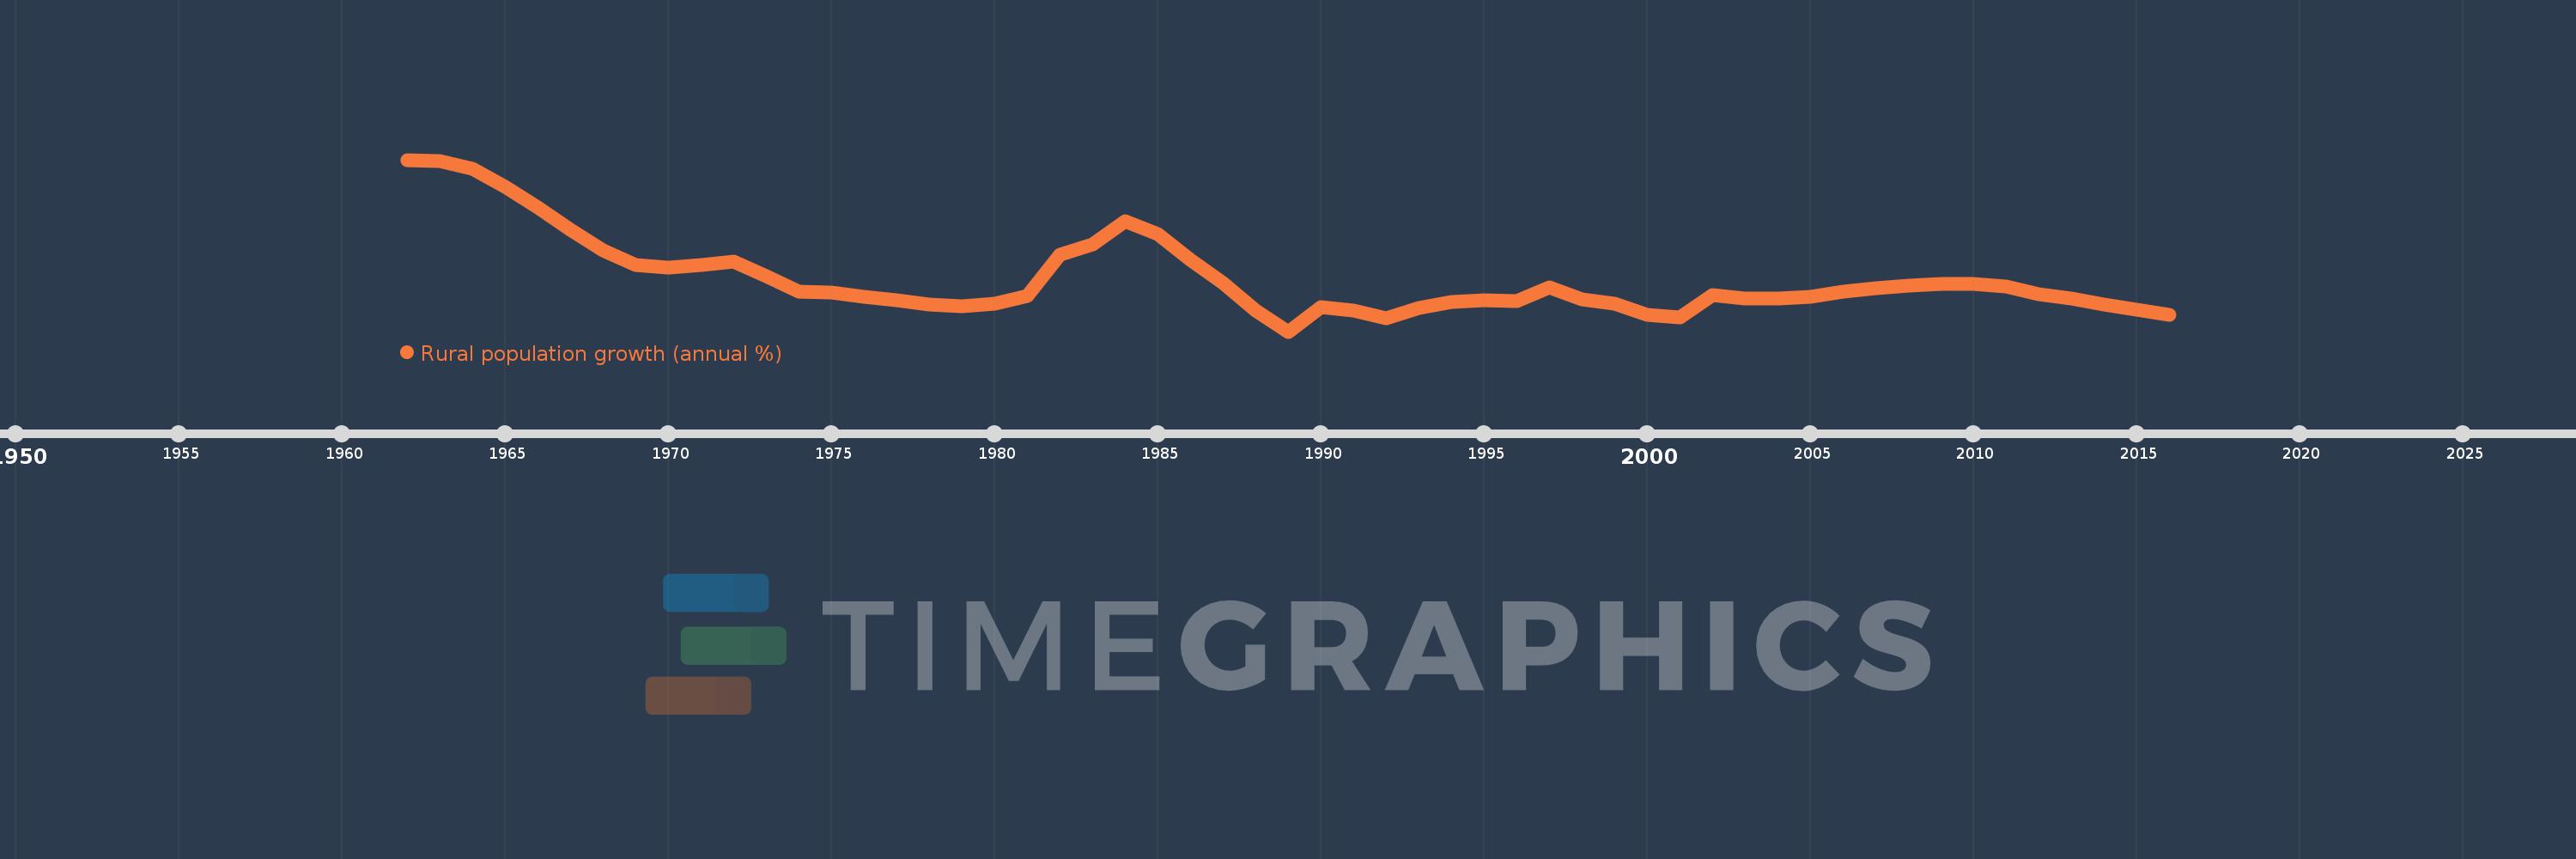
En esta escala de tiempo se presenta un gráfico de 1962 y 2016 de Caribbean small states. Los datos de 1961 están ausentes. El número de observaciones reales por fecha: 55.
Fuente (nombre):
Indicadores del desarrollo mundial
Fuente (organización):
World Bank Staff estimates based on United Nations, World Urbanization Prospects.
Categorías:
Agriculture & Rural Development
Se ha actualizado:
23 abr 2017 año
Los indicadores de los cambios de valor en los últimos años
Mínimo:
0.225
1 ene 1989 año
Máximo:
1.582
1 ene 1962 año
A la fecha de observación
Valor
Cambio absoluto
El cambio con respecto al valor anterior
1 ene 1962 año
1.582
+1.582
0.0%
1 ene 1963 año
1.574
-0.008
-0.48%
1 ene 1964 año
1.509
-0.065
-4.12%
1 ene 1965 año
1.371
-0.138
-9.15%
1 ene 1966 año
1.208
-0.163
-11.91%
1 ene 1967 año
1.03
-0.178
-14.75%
1 ene 1968 año
0.863
-0.167
-16.18%
1 ene 1969 año
0.753
-0.11
-12.76%
1 ene 1970 año
0.729
-0.024
-3.2%
1 ene 1971 año
0.754
+0.025
3.4%
1 ene 1972 año
0.778
+0.024
3.2%
1 ene 1973 año
0.666
-0.112
-14.36%
1 ene 1974 año
0.542
-0.124
-18.65%
1 ene 1975 año
0.531
-0.011
-2.03%
1 ene 1976 año
0.499
-0.032
-6.04%
1 ene 1977 año
0.474
-0.025
-5.04%
1 ene 1978 año
0.44
-0.034
-7.2%
1 ene 1979 año
0.423
-0.016
-3.74%
1 ene 1980 año
0.446
+0.023
5.37%
1 ene 1981 año
0.507
+0.061
13.74%
1 ene 1982 año
0.832
+0.325
64.17%
1 ene 1983 año
0.911
+0.078
9.4%
1 ene 1984 año
1.099
+0.188
20.65%
1 ene 1985 año
0.995
-0.104
-9.47%
1 ene 1986 año
0.793
-0.202
-20.28%
1 ene 1987 año
0.607
-0.185
-23.39%
1 ene 1988 año
0.389
-0.218
-35.94%
1 ene 1989 año
0.225
-0.164
-42.25%
1 ene 1990 año
0.421
+0.196
87.22%
1 ene 1991 año
0.394
-0.026
-6.29%
1 ene 1992 año
0.327
-0.067
-17.04%
1 ene 1993 año
0.413
+0.086
26.27%
1 ene 1994 año
0.458
+0.045
10.91%
1 ene 1995 año
0.474
+0.016
3.5%
1 ene 1996 año
0.467
-0.008
-1.6%
1 ene 1997 año
0.576
+0.109
23.47%
1 ene 1998 año
0.482
-0.094
-16.27%
1 ene 1999 año
0.445
-0.037
-7.67%
1 ene 2000 año
0.36
-0.085
-19.05%
1 ene 2001 año
0.339
-0.022
-6.02%
1 ene 2002 año
0.513
+0.174
51.43%
1 ene 2003 año
0.488
-0.025
-4.97%
1 ene 2004 año
0.488
+0.001
0.17%
1 ene 2005 año
0.498
+0.009
1.94%
1 ene 2006 año
0.538
+0.04
8.06%
1 ene 2007 año
0.566
+0.028
5.19%
1 ene 2008 año
0.588
+0.022
3.91%
1 ene 2009 año
0.601
+0.013
2.17%
1 ene 2010 año
0.599
-0.002
-0.35%
1 ene 2011 año
0.581
-0.018
-2.99%
1 ene 2012 año
0.523
-0.058
-9.93%
1 ene 2013 año
0.483
-0.041
-7.75%
1 ene 2014 año
0.439
-0.043
-9.0%
1 ene 2015 año
0.397
-0.042
-9.67%
1 ene 2016 año
0.359
-0.037
-9.45%
Ranking de los países por los datos estadísticos actuales


Comentarios: