29
/es/
es
AIzaSyAYiBZKx7MnpbEhh9jyipgxe19OcubqV5w
April 1, 2024
209747
New Zealand
NZL
true
2
1
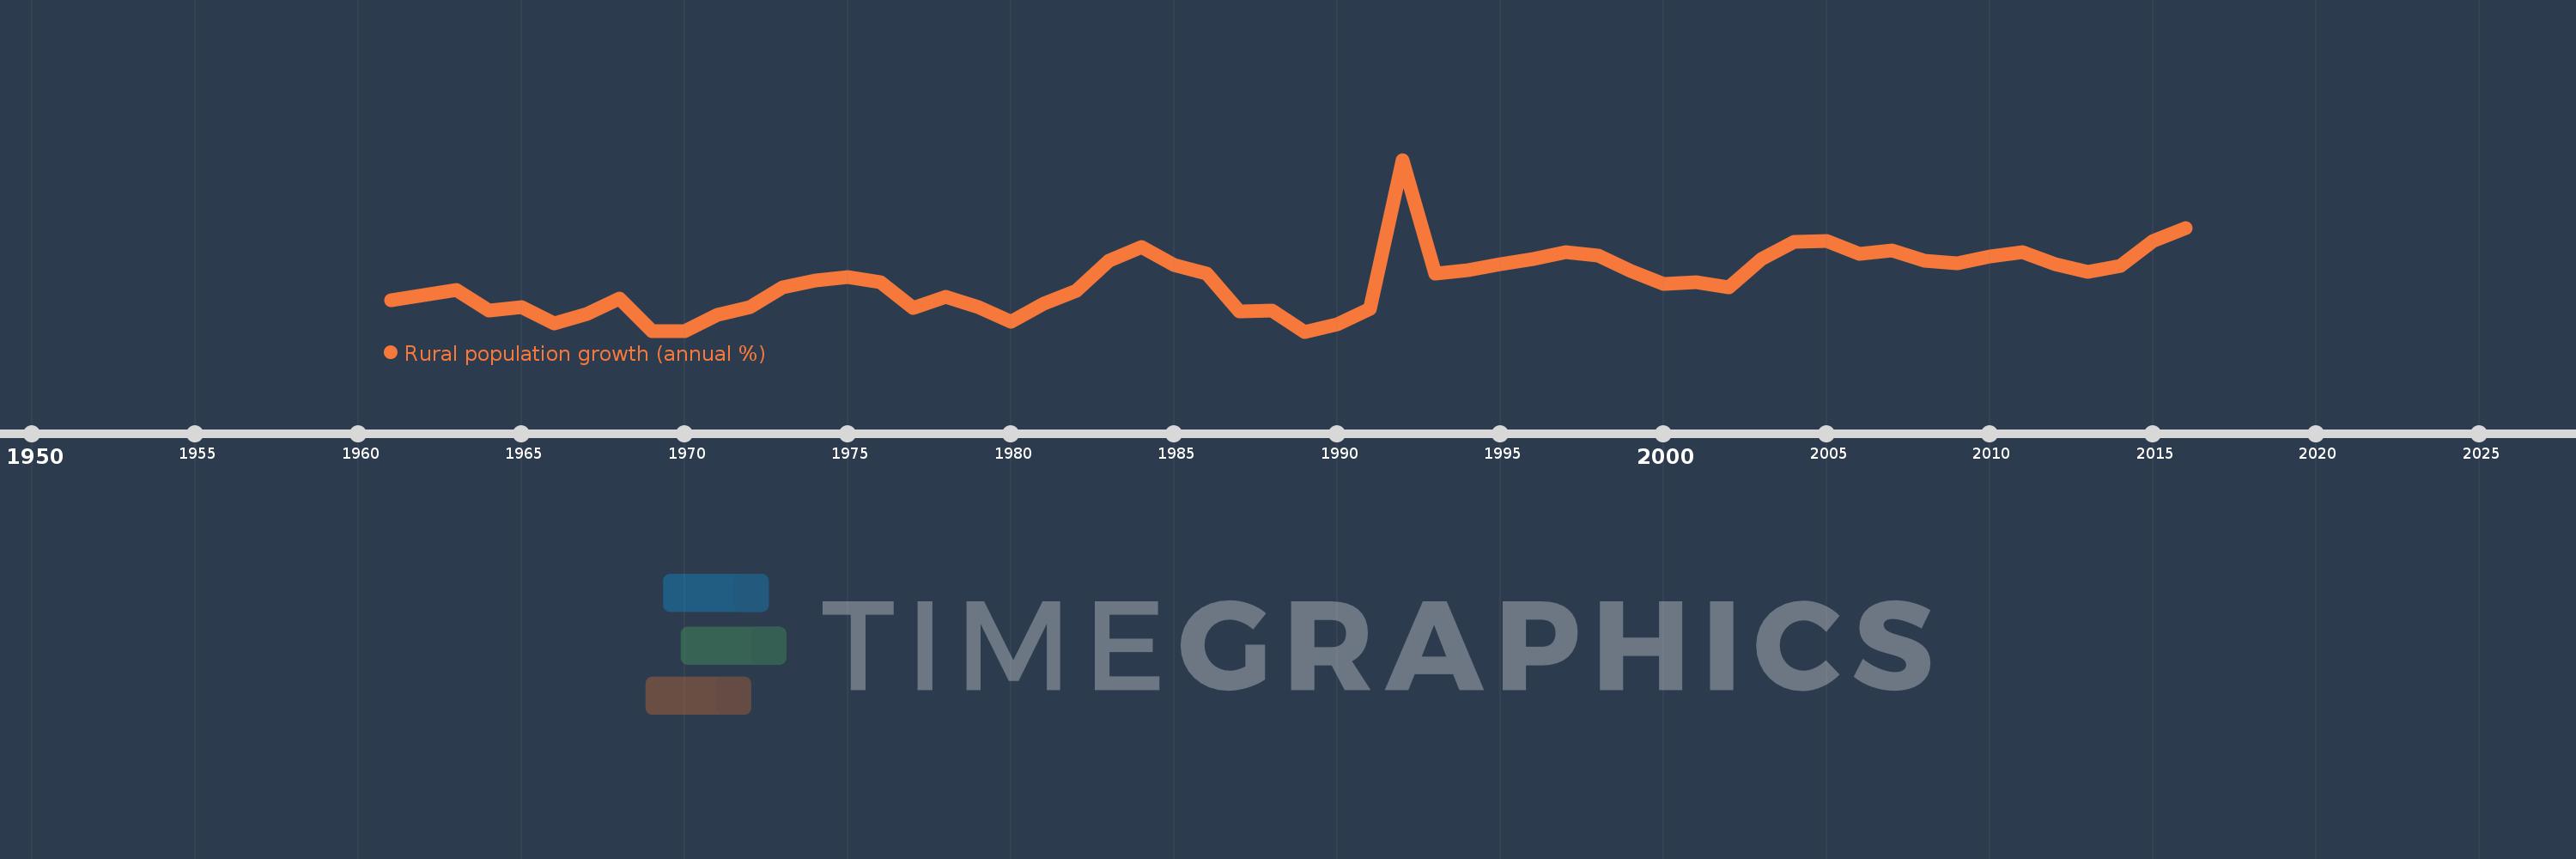
Rural population growth (annual %)
2016,2015,2014,2013,2012,2011,2010,2009,2008,2007,2006,2005,2004,2003,2002,2001,2000,1999,1998,1997,1996,1995,1994,1993,1992,1991,1990,1989,1988,1987,1986,1985,1984,1983,1982,1981,1980,1979,1978,1977,1976,1975,1974,1973,1972,1971,1970,1969,1968,1967,1966,1965,1964,1963,1962,1961
Estas estadísticas en otros países:
AfghanistanAlbaniaAlgeriaAmerican SamoaAndorraAngolaAntigua and BarbudaArab WorldArgentinaArmeniaArubaAustraliaAustriaAzerbaijanBahamas, TheBahrainBangladeshBarbadosBelarusBelgiumBelizeBeninBhutanBoliviaBosnia and HerzegovinaBotswanaBrazilBritish Virgin IslandsBrunei DarussalamBulgariaBurkina FasoBurundiCabo VerdeCambodiaCameroonCanadaCaribbean small statesCentral African RepublicCentral Europe and the BalticsChadChannel IslandsChileChinaColombiaComorosCongo, Dem. Rep.Congo, Rep.Costa RicaCote d'IvoireCroatiaCubaCuracaoCyprusCzech RepublicDenmarkDjiboutiDominicaDominican RepublicEarly-demographic dividendEast Asia & PacificEast Asia & Pacific (excluding high income)East Asia & Pacific (IDA & IBRD countries)EcuadorEgypt, Arab Rep.El SalvadorEquatorial GuineaEritreaEstoniaEthiopiaEuro areaEurope & Central AsiaEurope & Central Asia (excluding high income)Europe & Central Asia (IDA & IBRD countries)European UnionFaroe IslandsFijiFinlandFragile and conflict affected situationsFranceFrench PolynesiaGabonGambia, TheGeorgiaGermanyGhanaGreeceGreenlandGrenadaGuamGuatemalaGuineaGuinea-BissauGuyanaHaitiHeavily indebted poor countries (HIPC)High incomeHondurasHong Kong SAR, ChinaHungaryIBRD onlyIcelandIDA & IBRD totalIDA blendIDA onlyIDA totalIndiaIndonesiaIran, Islamic Rep.IraqIrelandIsle of ManIsraelItalyJamaicaJapanJordanKazakhstanKenyaKiribatiKorea, Dem. People’s Rep.Korea, Rep.KuwaitKyrgyz RepublicLao PDRLate-demographic dividendLatin America & Caribbean Latin America & Caribbean (excluding high income)Latin America & the Caribbean (IDA & IBRD countries)LatviaLeast developed countries: UN classificationLebanonLesothoLiberiaLibyaLiechtensteinLithuaniaLow & middle incomeLow incomeLower middle incomeLuxembourgMacao SAR, ChinaMacedonia, FYRMadagascarMalawiMalaysiaMaldivesMaliMaltaMarshall IslandsMauritaniaMauritiusMexicoMicronesia, Fed. Sts.Middle East & North AfricaMiddle East & North Africa (excluding high income)Middle East & North Africa (IDA & IBRD countries)Middle incomeMoldovaMongoliaMontenegroMoroccoMozambiqueMyanmarNamibiaNauruNepalNetherlandsNew CaledoniaNew ZealandNicaraguaNigerNigeriaNorth AmericaNorthern Mariana IslandsNorwayOECD membersOmanOther small statesPacific island small statesPakistanPalauPanamaPapua New GuineaParaguayPeruPhilippinesPolandPortugalPost-demographic dividendPre-demographic dividendPuerto RicoQatarRomaniaRussian FederationRwandaSamoaSan MarinoSao Tome and PrincipeSaudi ArabiaSenegalSerbiaSeychellesSierra LeoneSlovak RepublicSloveniaSmall statesSolomon IslandsSomaliaSouth AfricaSouth AsiaSouth Asia (IDA & IBRD)South SudanSpainSri LankaSt. Kitts and NevisSt. LuciaSt. Vincent and the GrenadinesSub-Saharan Africa Sub-Saharan Africa (excluding high income)Sub-Saharan Africa (IDA & IBRD countries)SudanSurinameSwazilandSwedenSwitzerlandSyrian Arab RepublicTajikistanTanzaniaThailandTimor-LesteTogoTongaTrinidad and TobagoTunisiaTurkeyTurkmenistanTurks and Caicos IslandsTuvaluUgandaUkraineUnited Arab EmiratesUnited KingdomUnited StatesUpper middle incomeUruguayUzbekistanVanuatuVenezuela, RBVietnamVirgin Islands (U.S.)West Bank and GazaWorldYemen, Rep.ZambiaZimbabwe línea de tiempo (timeline):
En esta escala de tiempo se presenta un gráfico de 1961 y 2016 de New Zealand. Los datos de 1960 están ausentes. El número de observaciones reales por fecha: 56.
Fuente (nombre):
Indicadores del desarrollo mundial
Fuente (organización):
World Bank Staff estimates based on United Nations, World Urbanization Prospects.
Categorías:
Agriculture & Rural Development
Se ha actualizado:
23 abr 2017 año
Los indicadores de los cambios de valor en los últimos años
Mínimo:
-1.258
1 ene 1989 año
Máximo:
3.585
1 ene 1992 año
A la fecha de observación
Valor
Cambio absoluto
El cambio con respecto al valor anterior
1 ene 1961 año
-0.376
-0.376
0.0%
1 ene 1962 año
-0.221
+0.155
-41.34%
1 ene 1963 año
-0.082
+0.138
-62.78%
1 ene 1964 año
-0.659
-0.577
702.75%
1 ene 1965 año
-0.576
+0.083
-12.53%
1 ene 1966 año
-1.033
-0.457
79.31%
1 ene 1967 año
-0.752
+0.281
-27.24%
1 ene 1968 año
-0.331
+0.421
-55.95%
1 ene 1969 año
-1.255
-0.924
278.83%
1 ene 1970 año
-1.247
+0.007
-0.59%
1 ene 1971 año
-0.794
+0.453
-36.32%
1 ene 1972 año
-0.565
+0.229
-28.87%
1 ene 1973 año
-0.02
+0.545
-96.51%
1 ene 1974 año
0.171
+0.19
-965.69%
1 ene 1975 año
0.283
+0.112
65.88%
1 ene 1976 año
0.139
-0.144
-50.84%
1 ene 1977 año
-0.601
-0.74
-532.03%
1 ene 1978 año
-0.28
+0.321
-53.46%
1 ene 1979 año
-0.568
-0.289
103.3%
1 ene 1980 año
-0.984
-0.415
73.05%
1 ene 1981 año
-0.476
+0.508
-51.6%
1 ene 1982 año
-0.117
+0.359
-75.35%
1 ene 1983 año
0.744
+0.862
-734.37%
1 ene 1984 año
1.116
+0.372
49.92%
1 ene 1985 año
0.615
-0.501
-44.9%
1 ene 1986 año
0.373
-0.242
-39.31%
1 ene 1987 año
-0.682
-1.055
-282.76%
1 ene 1988 año
-0.66
+0.022
-3.21%
1 ene 1989 año
-1.258
-0.598
90.59%
1 ene 1990 año
-1.044
+0.214
-17.01%
1 ene 1991 año
-0.612
+0.433
-41.43%
1 ene 1992 año
3.585
+4.197
-686.18%
1 ene 1993 año
0.369
-3.216
-89.71%
1 ene 1994 año
0.47
+0.101
27.3%
1 ene 1995 año
0.654
+0.184
39.27%
1 ene 1996 año
0.792
+0.137
21.01%
1 ene 1997 año
0.981
+0.189
23.87%
1 ene 1998 año
0.873
-0.108
-11.04%
1 ene 1999 año
0.445
-0.427
-48.95%
1 ene 2000 año
0.082
-0.364
-81.68%
1 ene 2001 año
0.142
+0.06
73.58%
1 ene 2002 año
-0.02
-0.162
-114.06%
1 ene 2003 año
0.777
+0.797
-4.0 mil%
1 ene 2004 año
1.262
+0.485
62.37%
1 ene 2005 año
1.3
+0.038
3.04%
1 ene 2006 año
0.943
-0.358
-27.51%
1 ene 2007 año
1.032
+0.09
9.54%
1 ene 2008 año
0.745
-0.287
-27.8%
1 ene 2009 año
0.661
-0.084
-11.27%
1 ene 2010 año
0.87
+0.208
31.52%
1 ene 2011 año
0.989
+0.119
13.68%
1 ene 2012 año
0.632
-0.357
-36.06%
1 ene 2013 año
0.425
-0.207
-32.76%
1 ene 2014 año
0.601
+0.176
41.46%
1 ene 2015 año
1.307
+0.705
117.29%
1 ene 2016 año
1.649
+0.342
26.14%
Ranking de los países por los datos estadísticos actuales


Comentarios: