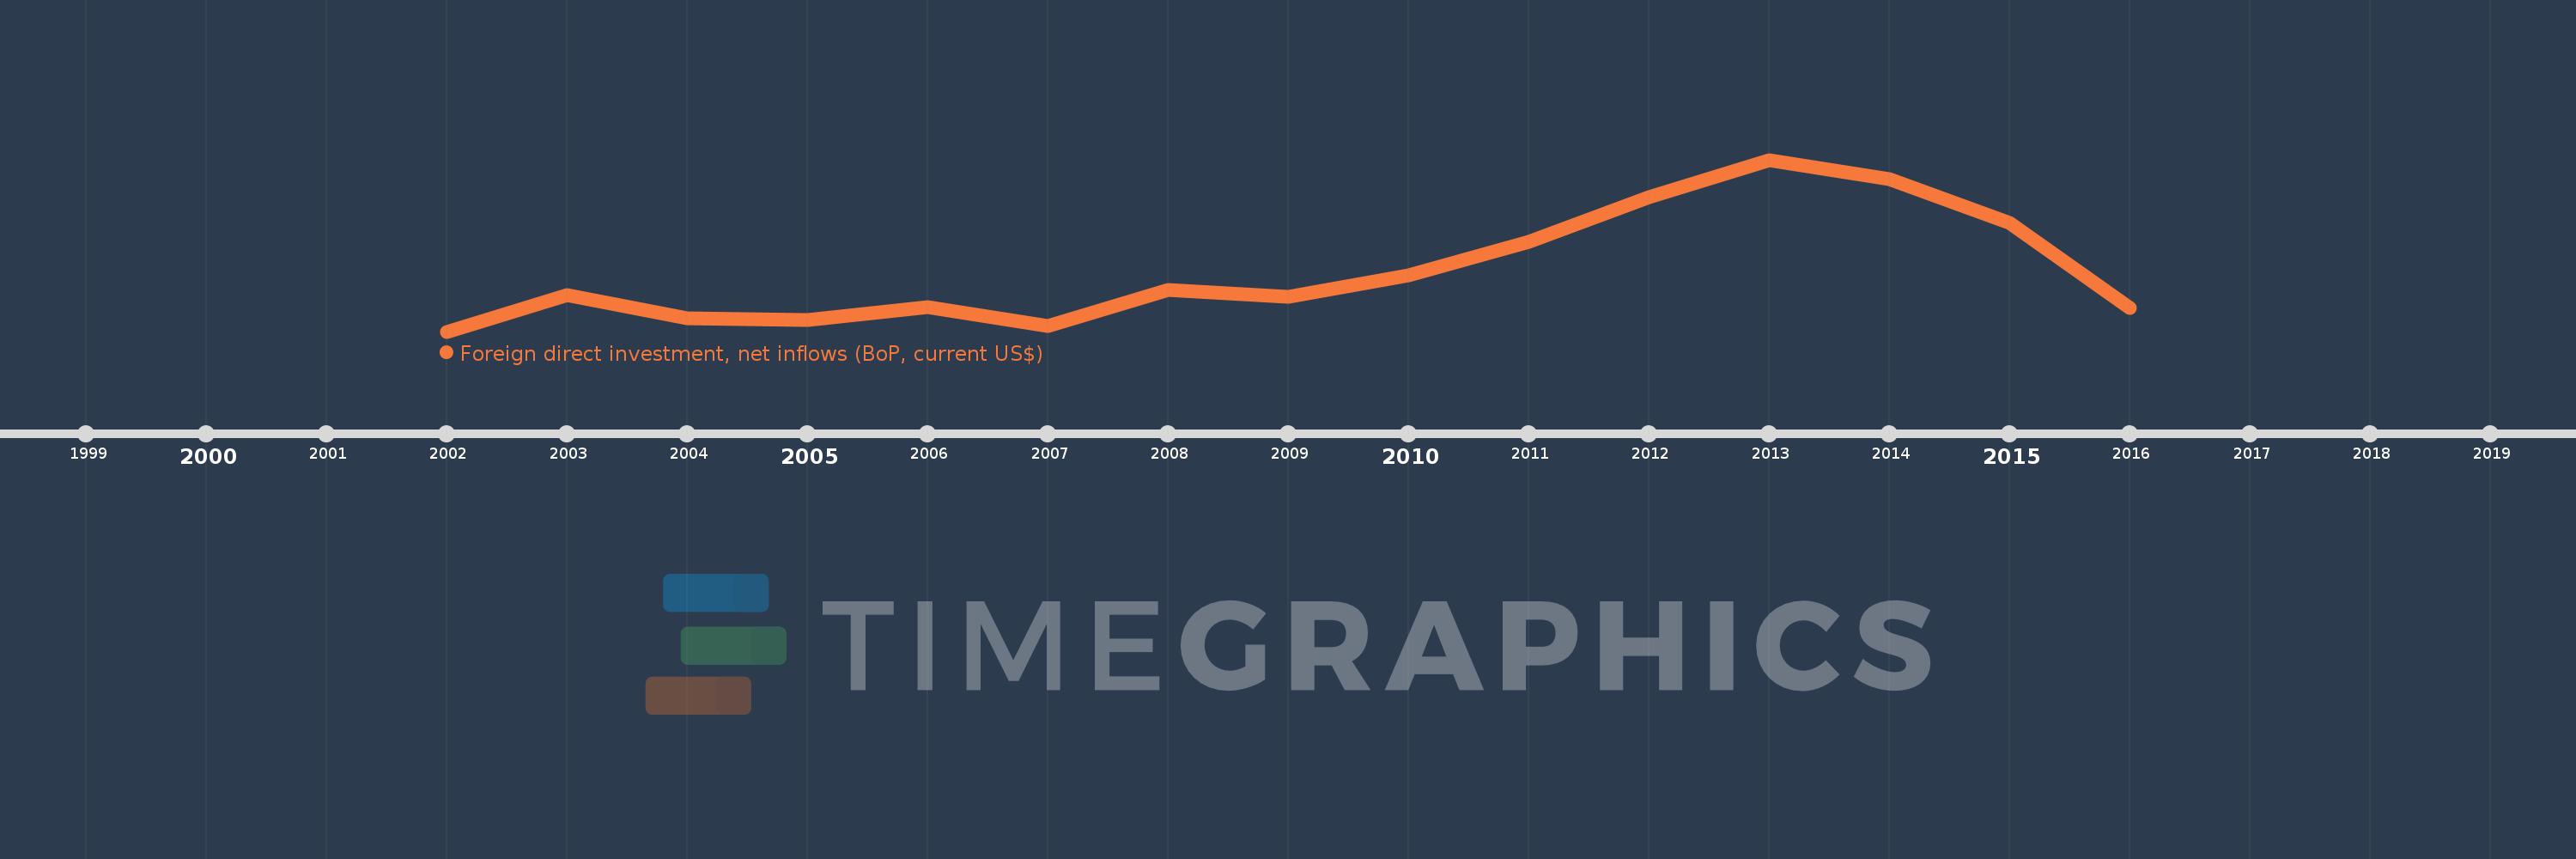
This timeline shows a graph from 2002 to 2016 of Brunei Darussalam. No data until 2001. Number of actual observations by date: 15.
Source name:
World Development Indicators
Source organization:
International Monetary Fund, Balance of Payments database, supplemented by data from the United Nations Conference on Trade and Development and official national sources.
Categories, topics:
Economy & Growth, Financial Sector, External Debt
Last updated:
apr 23, 2017
Indicators value changes by year
Meaning:
343.285 mln
Minimum:
60.695 mln
jan 1, 2002
Maximum:
864.906 mln
jan 1, 2013
At the date of observation
Value
Absolute change
Change from the previous value
jan 1, 2002
60.695 mln
+60.695 mln
0.0%
jan 1, 2003
229.672 mln
+168.977 mln
278.41%
jan 1, 2004
123.821 mln
-105.851 mln
-46.09%
jan 1, 2005
113.206 mln
-10.615 mln
-8.57%
jan 1, 2006
175.069 mln
+61.863 mln
54.65%
jan 1, 2007
87.839 mln
-87.229 mln
-49.83%
jan 1, 2008
257.636 mln
+169.797 mln
193.3%
jan 1, 2009
222.185 mln
-35.451 mln
-13.76%
jan 1, 2010
325.587 mln
+103.402 mln
46.54%
jan 1, 2011
480.723 mln
+155.136 mln
47.65%
jan 1, 2012
691.17 mln
+210.448 mln
43.78%
jan 1, 2013
864.906 mln
+173.735 mln
25.14%
jan 1, 2014
775.642 mln
-89.264 mln
-10.32%
jan 1, 2015
567.89 mln
-207.752 mln
-26.78%
jan 1, 2016
173.243 mln
-394.646 mln
-69.49%
Ranking of countries by current statistics by years