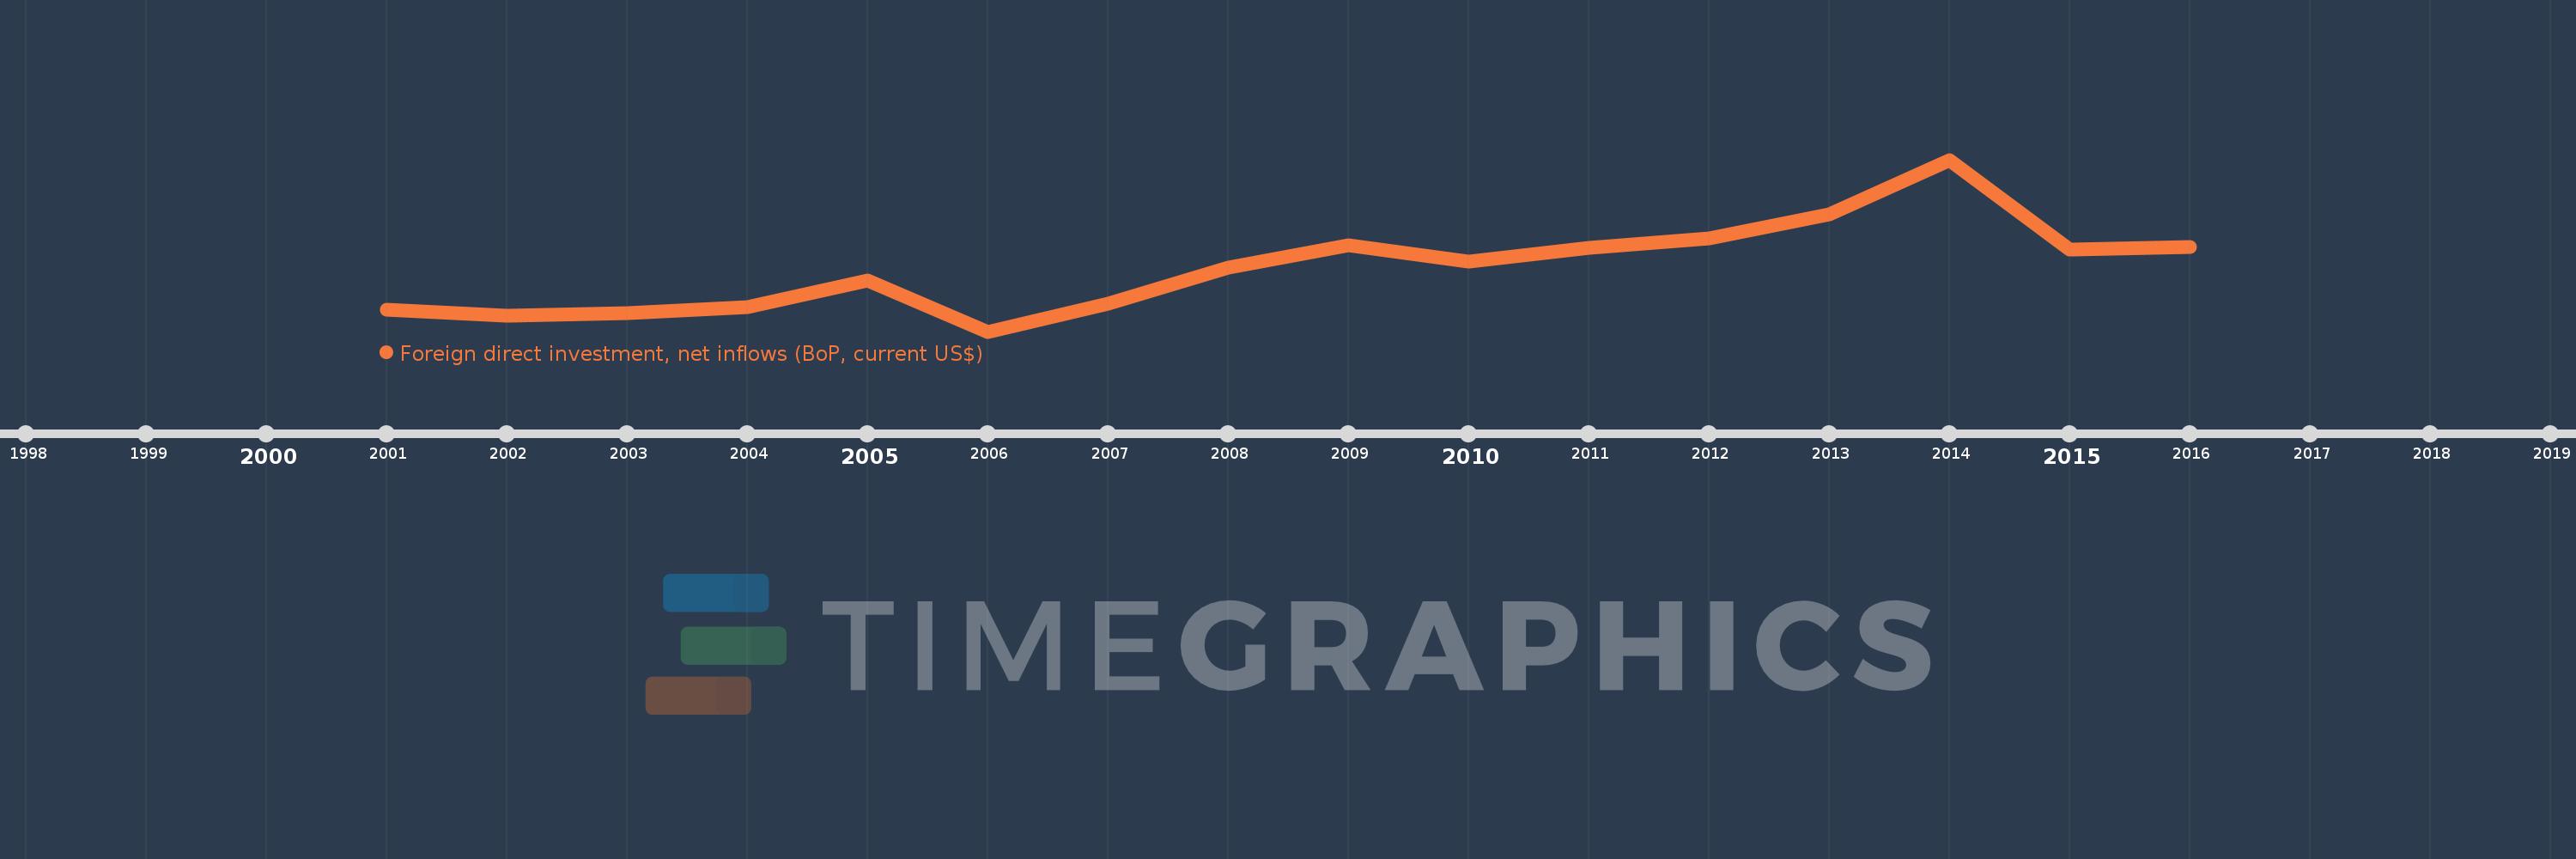
This timeline shows a graph from 2001 to 2016 of British Virgin Islands. No data until 2000. Number of actual observations by date: 16.
Source name:
World Development Indicators
Source organization:
International Monetary Fund, Balance of Payments database, supplemented by data from the United Nations Conference on Trade and Development and official national sources.
Categories, topics:
Economy & Growth, Financial Sector, External Debt
Last updated:
apr 23, 2017
Indicators value changes by year
Meaning:
36.782 bln
Minimum:
-7.142 bln
jan 1, 2006
Maximum:
112.128 bln
jan 1, 2014
At the date of observation
Value
Absolute change
Change from the previous value
jan 1, 2001
8.097 bln
+8.097 bln
0.0%
jan 1, 2002
3.789 bln
-4.308 bln
-53.2%
jan 1, 2003
5.451 bln
+1.661 bln
43.84%
jan 1, 2004
9.661 bln
+4.21 bln
77.23%
jan 1, 2005
28.31 bln
+18.649 bln
193.05%
jan 1, 2006
-7.142 bln
-35.452 bln
-125.23%
jan 1, 2007
12.015 bln
+19.157 bln
-268.22%
jan 1, 2008
37.139 bln
+25.125 bln
209.12%
jan 1, 2009
52.583 bln
+15.443 bln
41.58%
jan 1, 2010
41.59 bln
-10.993 bln
-20.91%
jan 1, 2011
51.226 bln
+9.636 bln
23.17%
jan 1, 2012
57.576 bln
+6.35 bln
12.4%
jan 1, 2013
74.502 bln
+16.926 bln
29.4%
jan 1, 2014
112.128 bln
+37.626 bln
50.5%
jan 1, 2015
49.986 bln
-62.142 bln
-55.42%
jan 1, 2016
51.606 bln
+1.62 bln
3.24%
Ranking of countries by current statistics by years